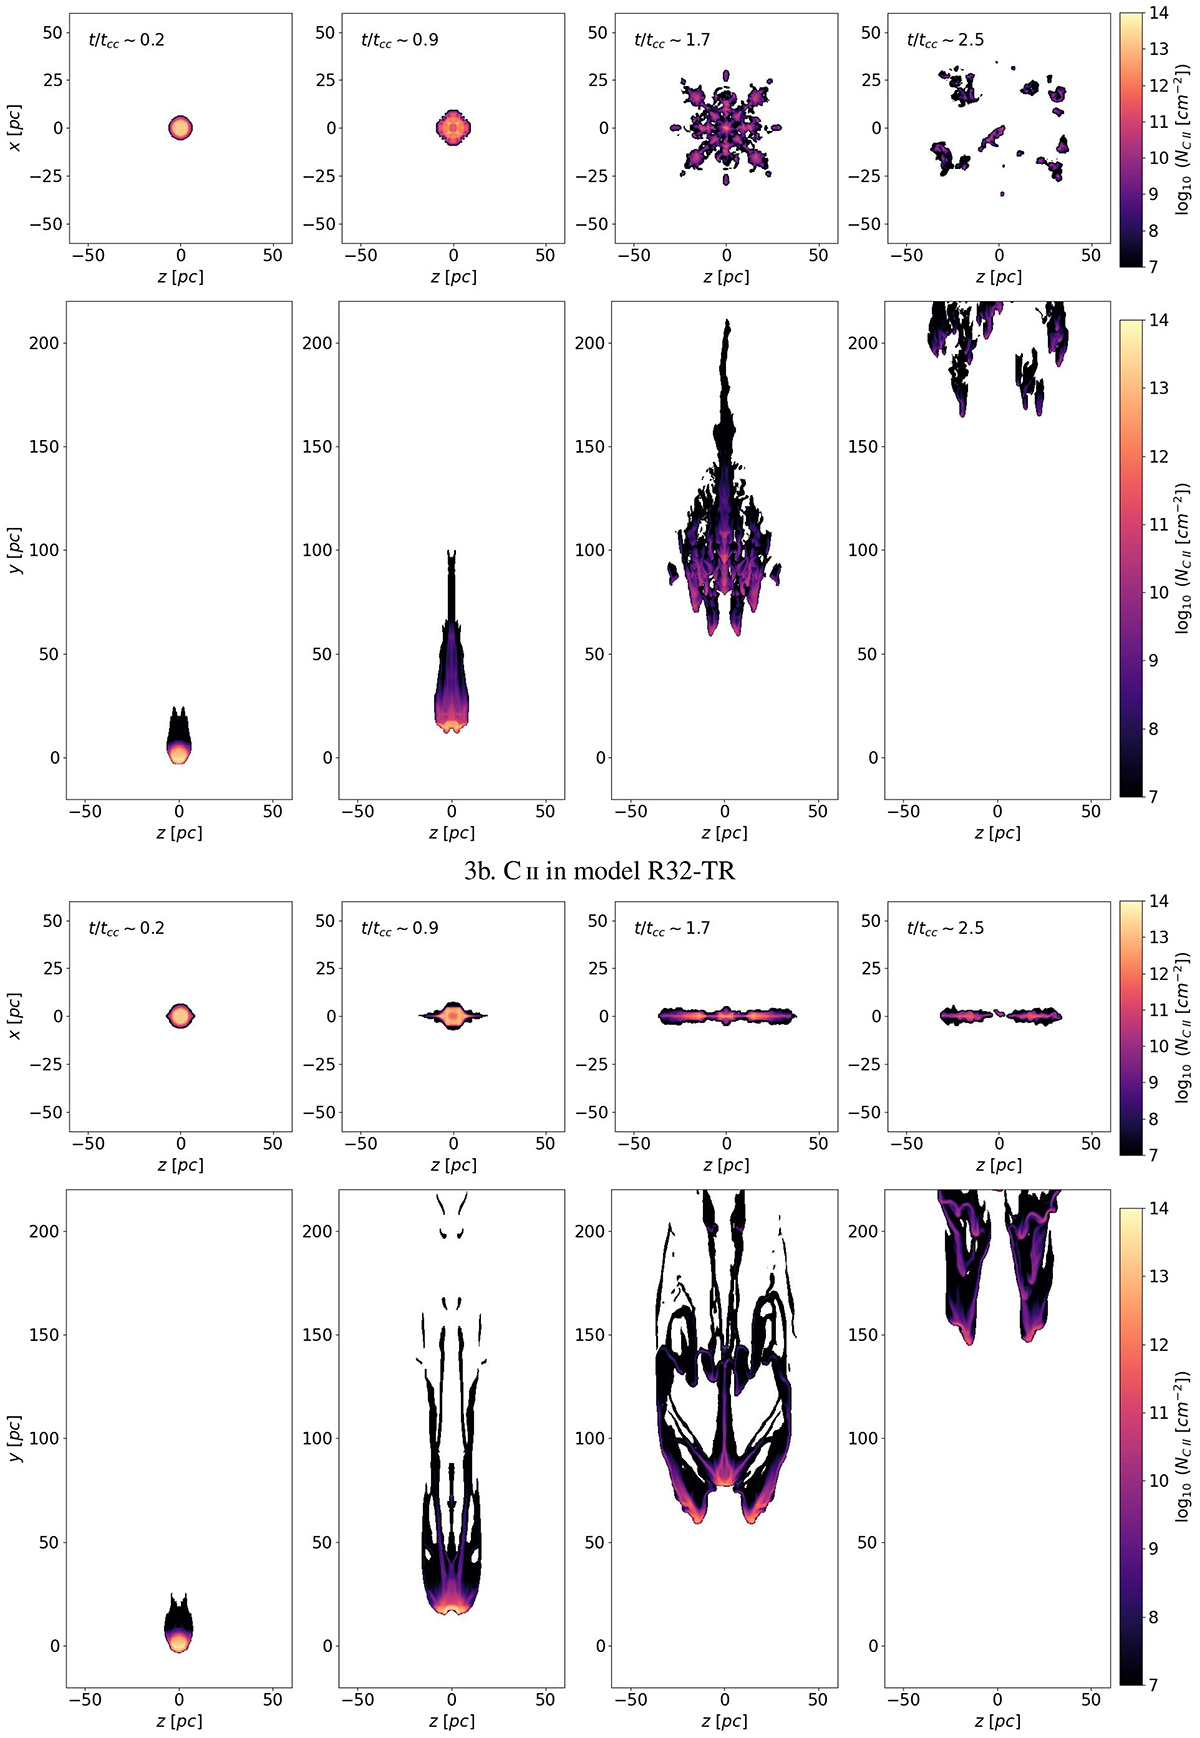
Fig. 3.
Download original image
2D maps showing the column densities of C II. Panel 3a shows the projections for R32-AL simulation along the y-axis for down-the-barrel images (top) and along the x-axis for edge-on (bottom). The same for the model R32-TR in panel 3b. From left to right, the plots display C II column densities at t = 0.2, 1.2, 2.2 and 3.2 Myr (or t/tcc = 0.2, 0.9, 1.7, 2.5) respectively. We note how C II, tracer of the cold and dense gas, in the down-the-barrel projections of model R32-TR, survives up to t/tcc ∼ 2.5 via magnetic shielding.
Current usage metrics show cumulative count of Article Views (full-text article views including HTML views, PDF and ePub downloads, according to the available data) and Abstracts Views on Vision4Press platform.
Data correspond to usage on the plateform after 2015. The current usage metrics is available 48-96 hours after online publication and is updated daily on week days.
Initial download of the metrics may take a while.