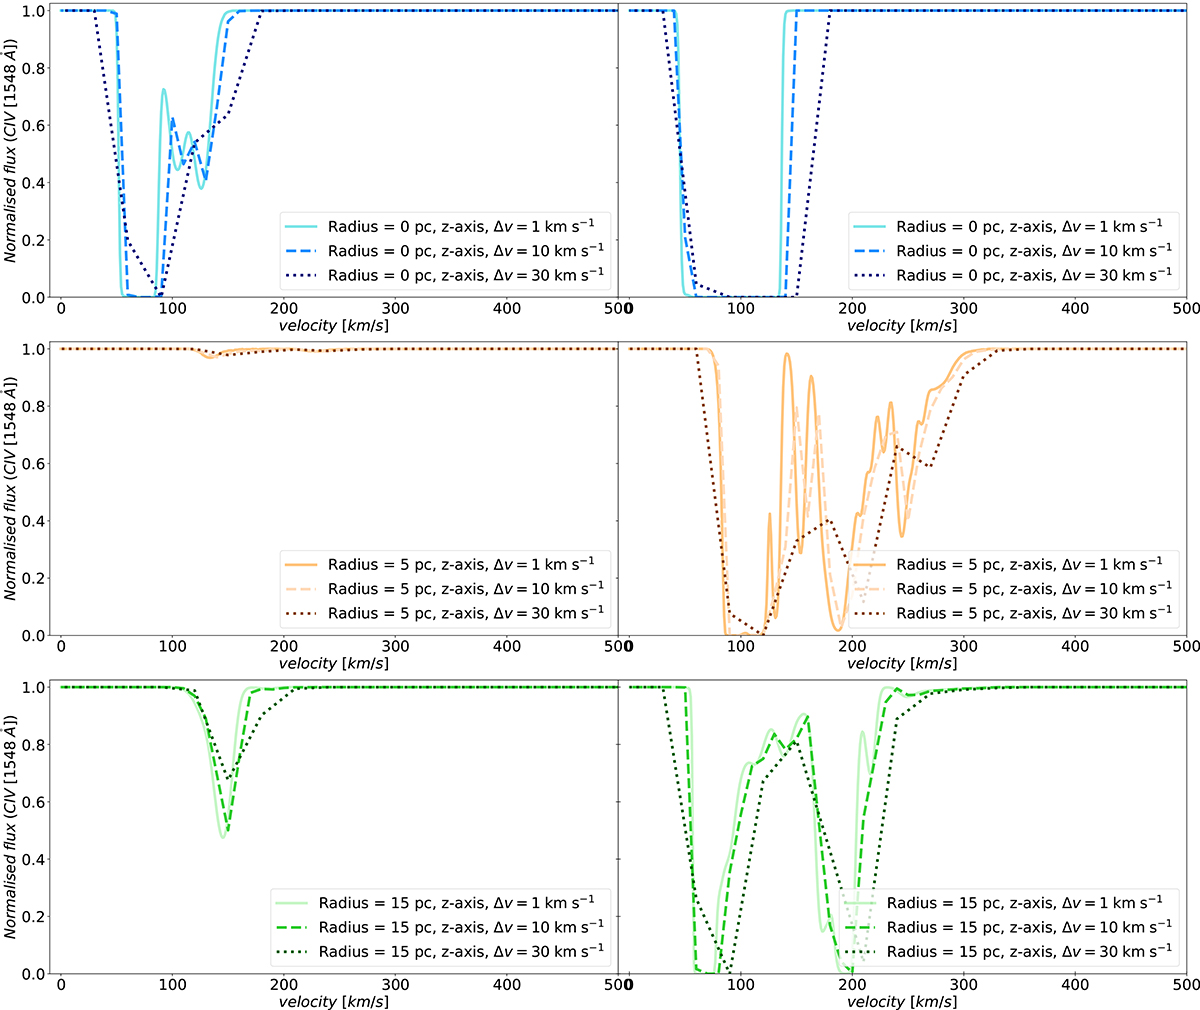
Fig. B.1.
Download original image
Absorption spectra of C IV generated with light rays passing through the centre (upper panels), at 5 pc from the centre (middle panels), and at 15 pc from the centre (bottom panels), all along the z-axis. In this figure, we display the absorption profiles produced with R32-AL on the left and R32-TR on the right. In the same panel, different lines have different spectral resolution: 1 km s−1 (solid), 10 km s−1 (dashed) and 30 km s−1 (dotted).
Current usage metrics show cumulative count of Article Views (full-text article views including HTML views, PDF and ePub downloads, according to the available data) and Abstracts Views on Vision4Press platform.
Data correspond to usage on the plateform after 2015. The current usage metrics is available 48-96 hours after online publication and is updated daily on week days.
Initial download of the metrics may take a while.