Fig. A.3.
Download original image
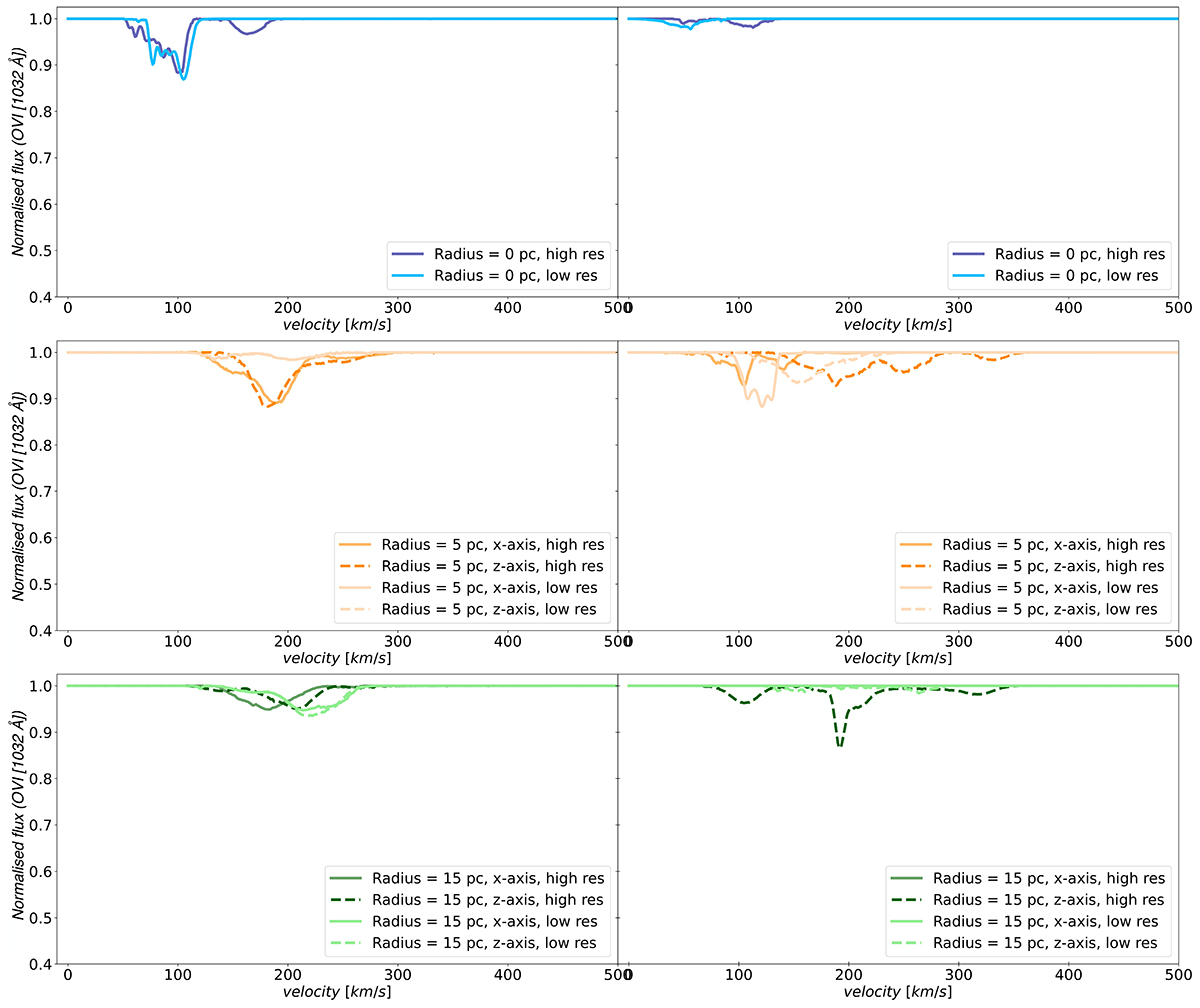
Absorption spectra of O VI generated with light rays passing through the centre (upper panels), at 5 pc from the centre (middle panels), and at 15 pc from the centre (bottom panels). In this figure, we display in the left panels the absorption profiles produced with R32-AL and R16-AL, both having a magnetic field aligned with the wind direction. On the right ones, the simulations displayed are R32-TR and R16-TR, with a transverse magnetic field. The higher resolution spectra are represented with darker colours: dark blue in the upper panels, red in the middle, and dark green in the bottom. While, the lower resolution ones are plotted in light blue (upper panels), orange (middle), and light green (bottom). Solid lines show the spectra generated with light rays passing at 5 and 15 pc along the z-axis, while dashed lines along the x-axis.
Current usage metrics show cumulative count of Article Views (full-text article views including HTML views, PDF and ePub downloads, according to the available data) and Abstracts Views on Vision4Press platform.
Data correspond to usage on the plateform after 2015. The current usage metrics is available 48-96 hours after online publication and is updated daily on week days.
Initial download of the metrics may take a while.