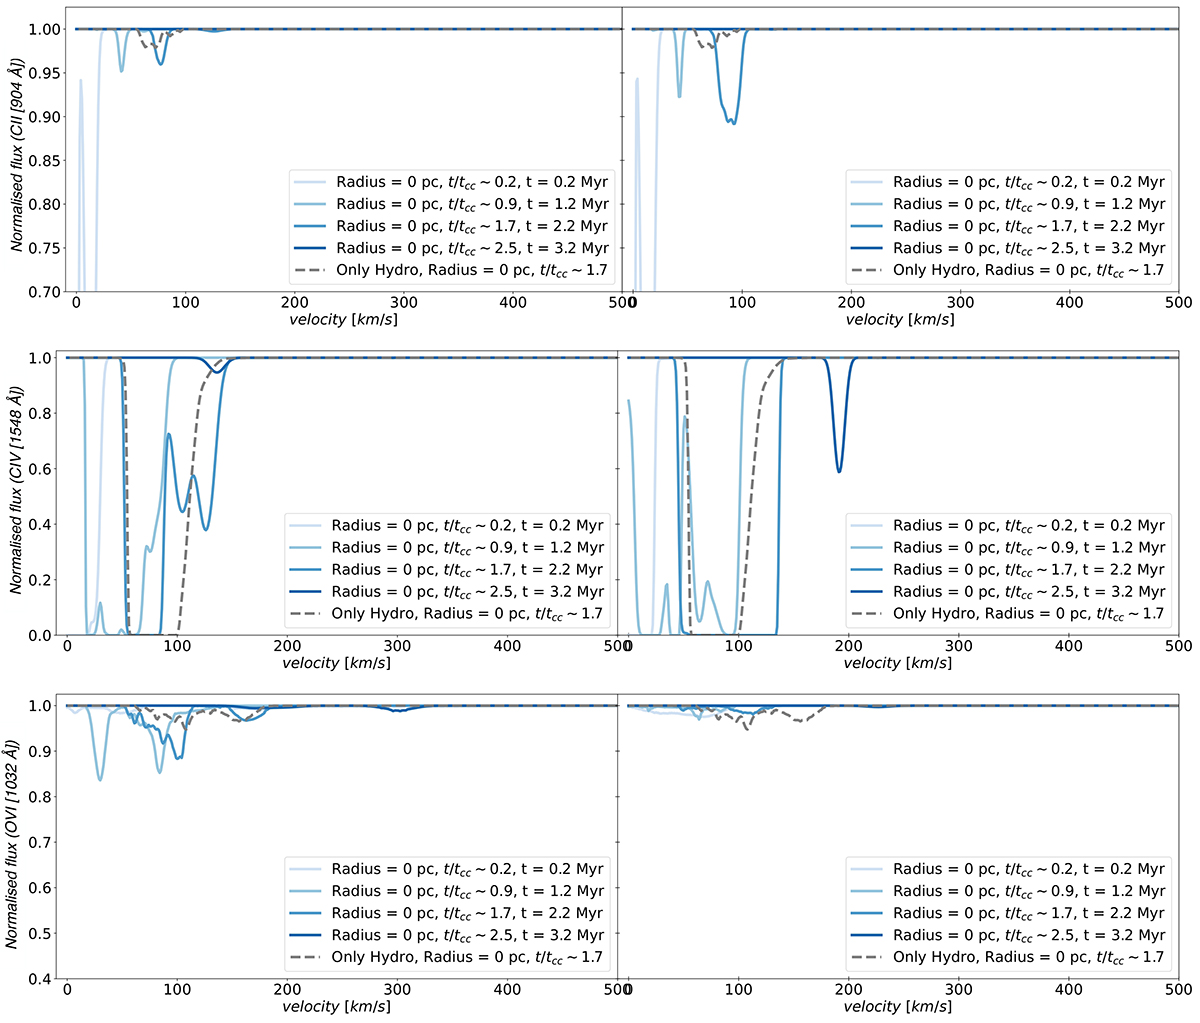
Fig. 13.
Download original image
Temporal evolution of the absorption spectra of one ion for each gas phase, generated with a light ray passing through the centre of the cloud. The absorption lines are generated at t = 0.2, 1.2, 2.2, 3.2 Myr (or t/tcc = 0.2, 0.9, 1.7, 2.5) respectively. We display C II as representative ion for the cold phase (top), C IV for the intermediate temperature one (middle), and O VI for the warm gas (bottom). As in Section 3.4, on the left side we show the simulation R32-AL, with an aligned magnetic field and on the right R32-TR, with a transverse magnetic field. We see that in R32-TR the gas reaches overall higher velocities than R32-AL at all times, particularly for the intermediate ions, which show velocities of 100 − 200 km s−1 at t/tcc = 1.7. We also stress that the intermediate gas phase is the one that shows broader and deeper lines at all times when the magnetic field is transverse.
Current usage metrics show cumulative count of Article Views (full-text article views including HTML views, PDF and ePub downloads, according to the available data) and Abstracts Views on Vision4Press platform.
Data correspond to usage on the plateform after 2015. The current usage metrics is available 48-96 hours after online publication and is updated daily on week days.
Initial download of the metrics may take a while.