Fig. 10.
Download original image
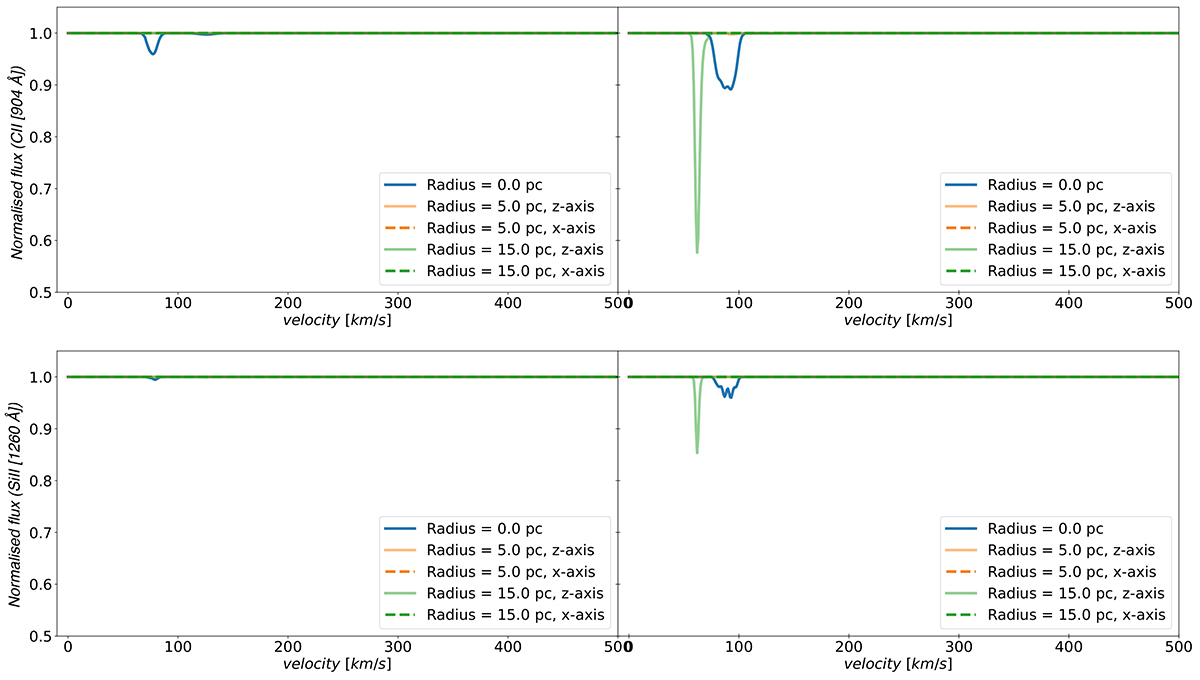
Absorption spectra at t/tcc = 1.7 of ions tracing the cold phase of the gas generated with light rays passing through the centre (in blue), 5 pc from the centre along the x- (dashed orange line) and z-axis (solid orange line), and 15 pc from the centre along the x- (dashed green line) and z-axis (solid green line). In this figure, we display in the upper left panel the absorption profiles of the C II in the simulation R32-AL, in the upper right panel the C II in R32-TR, while the lower panels show the lines of the Si II in the simulation R32-AL (left) and R32-TR (right). We show that C II and Si II are tracers of the denser part of the cloud. These ions produce deeper absorption lines in the presence of a transverse magnetic field (see also Fig. C.1 for t/tcc = 1.2). At t/tcc = 1.7, the differences are evident along the lines of sight observing the cloud centre and at 15 pc from the centre in the direction of the magnetic field, while at t/tcc = 1.2 the differences can be seen along the cloud centre and at 5 pc from it.
Current usage metrics show cumulative count of Article Views (full-text article views including HTML views, PDF and ePub downloads, according to the available data) and Abstracts Views on Vision4Press platform.
Data correspond to usage on the plateform after 2015. The current usage metrics is available 48-96 hours after online publication and is updated daily on week days.
Initial download of the metrics may take a while.