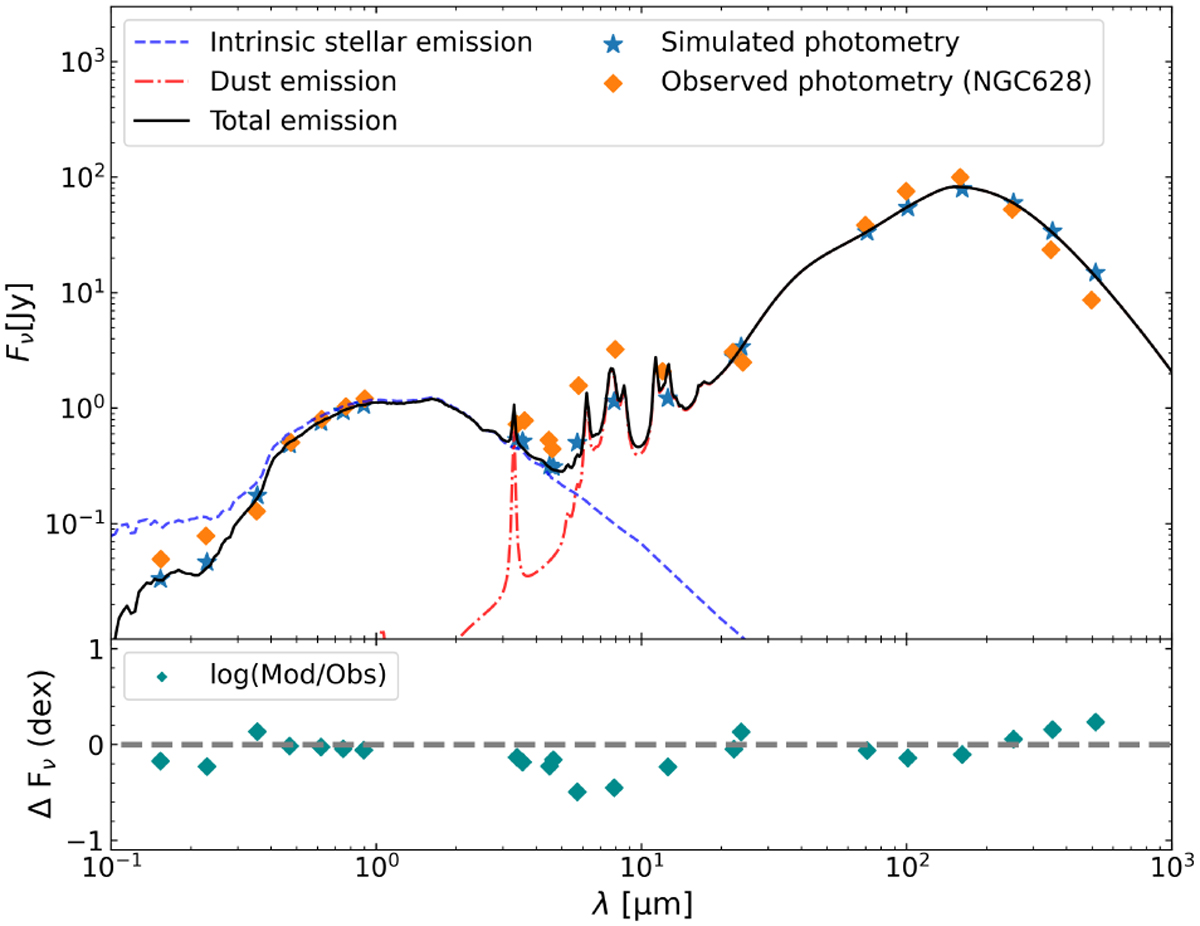
Fig. 9
Download original image
Comparison of the global SED between the NGC 628-like galaxy simulation and actual observations. Upper panel: global SED of the NGC 628-like galaxy simulation at t = 10 Gyr shown with the black solid line. Blue dashed and red dash-dotted lines represent the intrinsic stellar and dust emission, respectively. The orange and blue diamonds correspond to the simulated and observed photomeries of the total SEDs (van der Giessen et al., in prep.), respectively. Lower panel: difference in the photometries between the simulation and observation data.
Current usage metrics show cumulative count of Article Views (full-text article views including HTML views, PDF and ePub downloads, according to the available data) and Abstracts Views on Vision4Press platform.
Data correspond to usage on the plateform after 2015. The current usage metrics is available 48-96 hours after online publication and is updated daily on week days.
Initial download of the metrics may take a while.