Fig. 8
Download original image
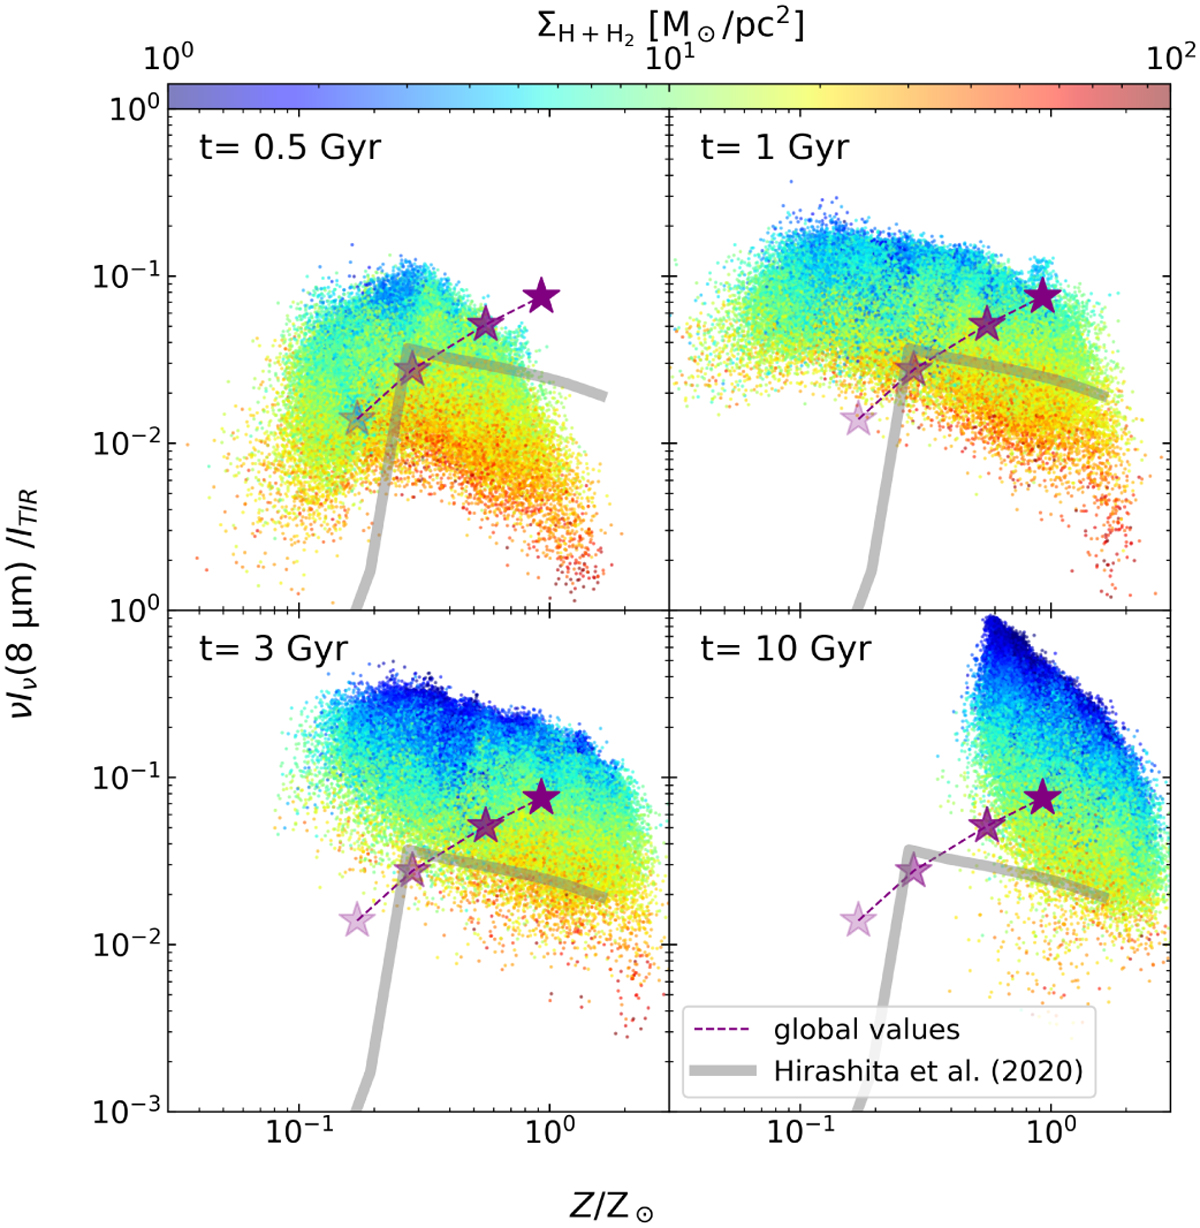
Time evolution of pixel-based relation among the 8 μm-to-total IR intensity ratio, gas-phase metallicity, and hydrogen surface density for the Milky Way-like galaxy simulation. The panels show the relation at t = 0.5, 1.0, 3.0, and 10 Gyr from top left to bottom right. The color bar indicates the hydrogen surface density of each pixel. In each panel, the time evolution of the entire distribution over the four epochs is also indicated by the purple dashed lines. The purple star symbols represent the global intensity ratio and metallicity of the galaxy at t = 0.5, 1.0, 3.0, and 10 Gyr from the lower left to the upper right in each panel (the symbol transparency decreases) and are connected by the dashed line. We note that the intensity ratio and metallicity are the intensity- and mass-weighted values, respectively. The grey line shows the evolutionary path in the one-zone dust evolution model by Hirashita & Murga (2020) under the condition of ƒdense = 0.5, τSF = 5 Gyr, and UMW = 1.
Current usage metrics show cumulative count of Article Views (full-text article views including HTML views, PDF and ePub downloads, according to the available data) and Abstracts Views on Vision4Press platform.
Data correspond to usage on the plateform after 2015. The current usage metrics is available 48-96 hours after online publication and is updated daily on week days.
Initial download of the metrics may take a while.