Fig. 4
Download original image
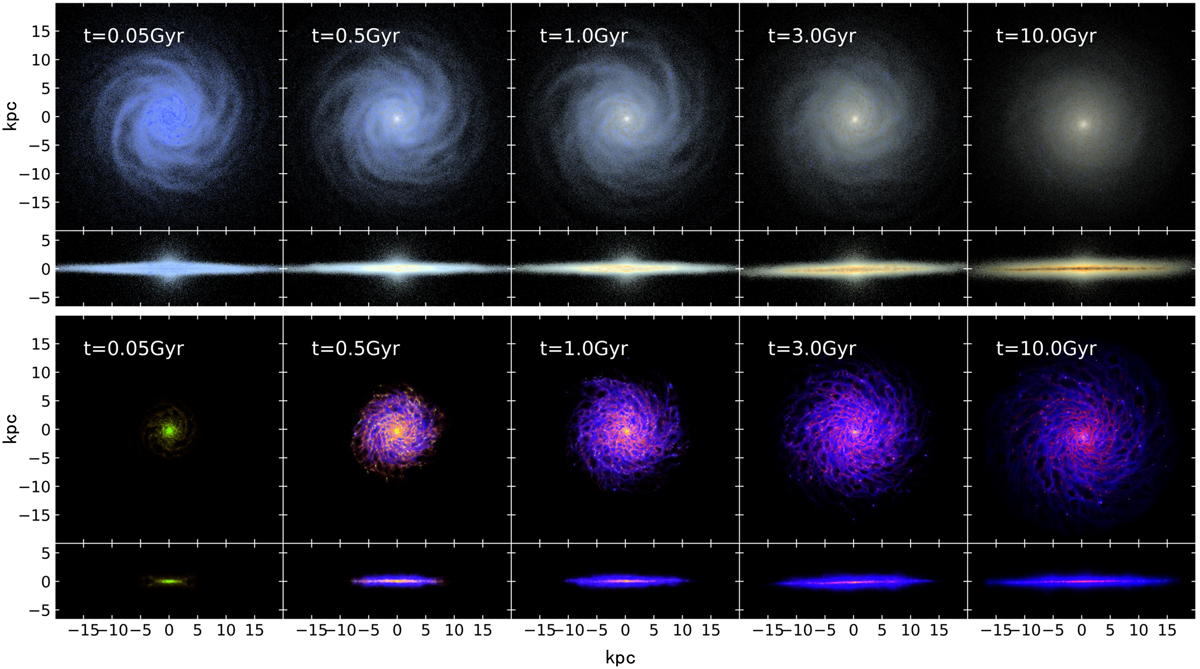
Evolution of stellar (first and second rows) and dust emission maps (third and fourth rows) of the Milky Way-like galaxy simulation. The panels show the emission maps at t = 0.05, 0.5, 1, 3, and 10 Gyr from left to right. The images on the first and third (second and fourth) rows are face-on (edge-on) views. The stellar emission maps consist of the SDSS i (red), r (green), and 𝑔 (blue) fluxes with an additionally enhanced blue level for the GALEX FUV flux. The dust emission maps are synthesized by the Spitɀer IRAC 8 μm (blue), Herschel PACS 70 μm (green), and Herschel PACS 160 μm (red) fluxes.
Current usage metrics show cumulative count of Article Views (full-text article views including HTML views, PDF and ePub downloads, according to the available data) and Abstracts Views on Vision4Press platform.
Data correspond to usage on the plateform after 2015. The current usage metrics is available 48-96 hours after online publication and is updated daily on week days.
Initial download of the metrics may take a while.