Open Access
Fig. 3
Download original image
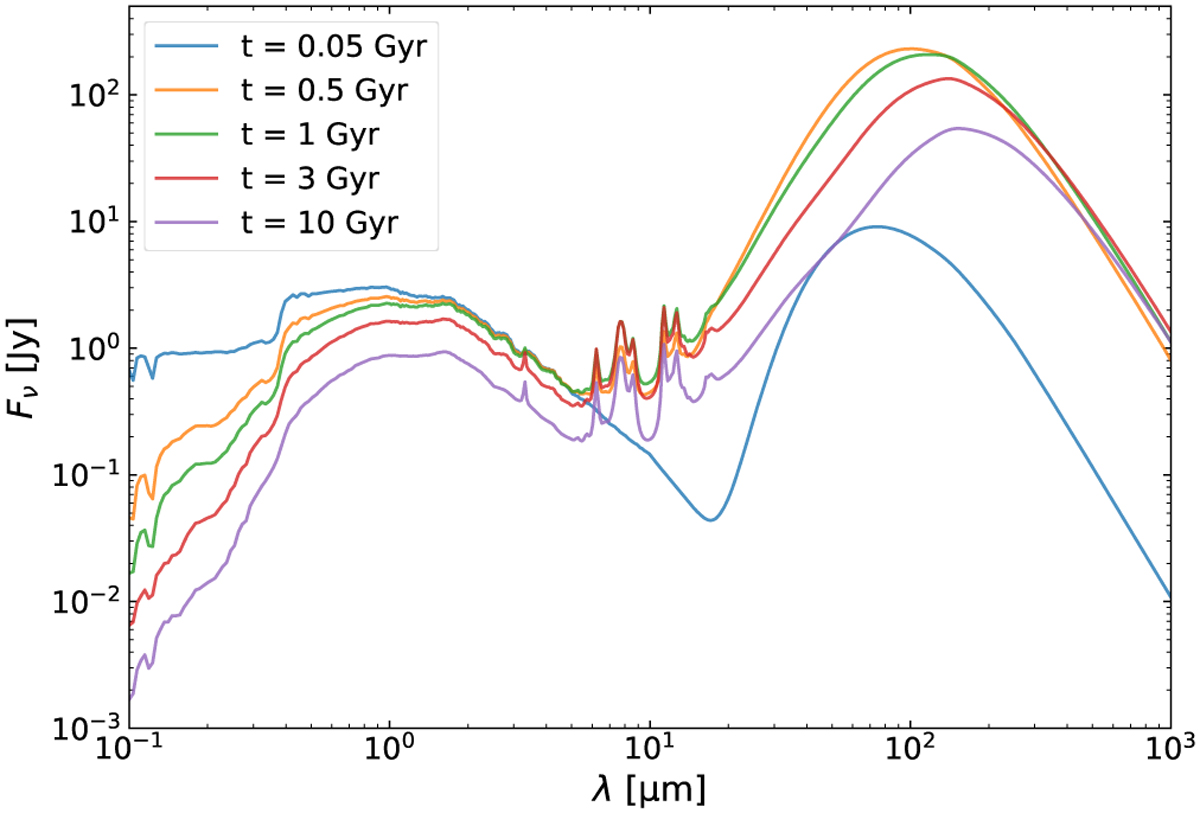
Evolution of the global SED for the Milky Way-like galaxy simulation. The lines in different colors correspond to the total SEDs at t = 0.05, 0.5, 1, 3, and 10 Gyr (cyan, orange, green, red, and purple lines, respectively). The observed flux density is estimated at a distance of 10 Mpc.
Current usage metrics show cumulative count of Article Views (full-text article views including HTML views, PDF and ePub downloads, according to the available data) and Abstracts Views on Vision4Press platform.
Data correspond to usage on the plateform after 2015. The current usage metrics is available 48-96 hours after online publication and is updated daily on week days.
Initial download of the metrics may take a while.