Fig. B.1
Download original image
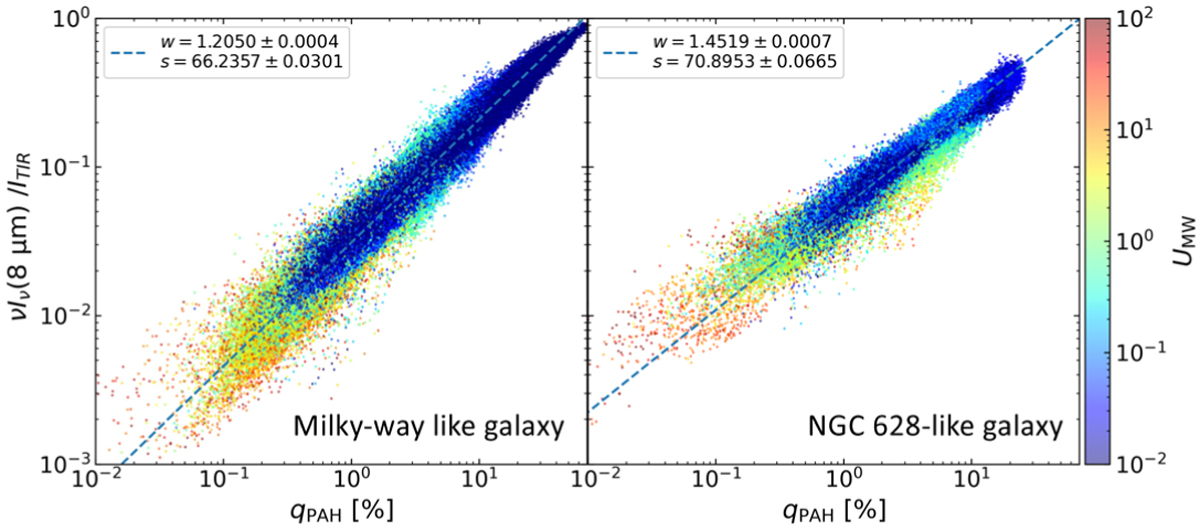
Pixel-based relation between the 8 μm-to-total IR intensity ratio and the PAH mass fraction of the Milky Way-like and NGC 628-like galaxies using all snapshots at t = 0.5, 1.0, 3.0, and 10 Gyr (left and right panels, respectively). The color represents the density-weighted mean intensity at 1000 Å relative to the Milky Way value as indicated by the color bar. Blue dashed lines indicate the best-fit relation of Eq. (B.1), and the legend indicates the best-fit parameter.
Current usage metrics show cumulative count of Article Views (full-text article views including HTML views, PDF and ePub downloads, according to the available data) and Abstracts Views on Vision4Press platform.
Data correspond to usage on the plateform after 2015. The current usage metrics is available 48-96 hours after online publication and is updated daily on week days.
Initial download of the metrics may take a while.