Fig. 11
Download original image
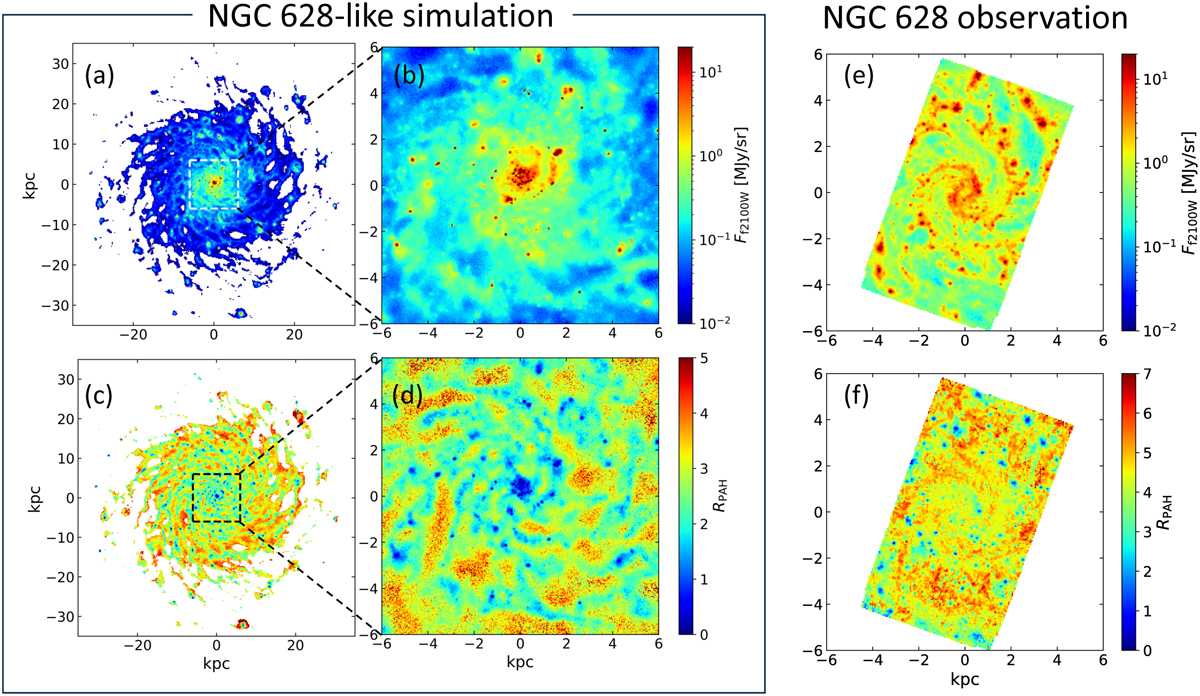
Comparison of 21 μm intensity and RPAH maps between the NGC 628-like galaxy simulation and the JWST observations. Panels a and b: 21 μm intensity maps of the NGC 628-like galaxy simulation at 10 Gyr on 100 and 20 kpc scales, respectively. Panels c and d: RPAH maps of the simulation on 100 and 20 kpc scales, respectively. Panels e and ſ: maps of the 21 μm intensity and RPAH based on the JWST/MIRI observations for NGC 628 (Lee et al. 2023), where the spatial resolutions are reduced to 50 pc.
Current usage metrics show cumulative count of Article Views (full-text article views including HTML views, PDF and ePub downloads, according to the available data) and Abstracts Views on Vision4Press platform.
Data correspond to usage on the plateform after 2015. The current usage metrics is available 48-96 hours after online publication and is updated daily on week days.
Initial download of the metrics may take a while.