Fig. 10
Download original image
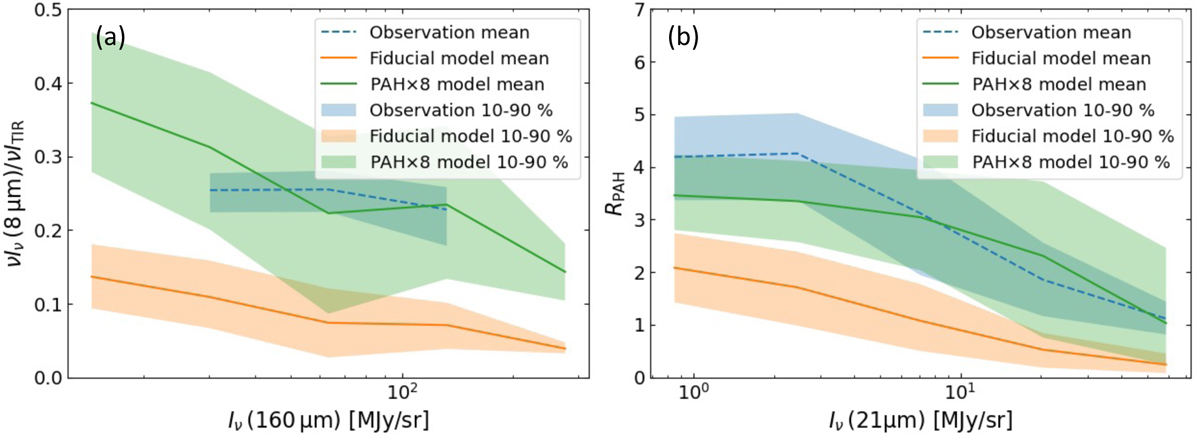
Pixel-based comparison of the indicators of the PAH mass fraction between the NGC 628-like galaxy simulation and actual observations. Panel a: vIv(8 μm)/ITIR versus the 160 μm intensity for the NGC 628-like galaxy simulation at t = 10 Gyr (orange) and based on the Herschel and Spitɀer observations for NGC 628 (blue). Panel b: RPAH versus the 21 μm intensity for the NGC 628-like galaxy simulation at t = 10 Gyr (orange) and based on the JWST observations for NGC 628 (blue). In both panels, the green color represents the model, in which the PAH mass is enhanced by a factor of eight. The solid and dashed lines represent the mean value over all pixels of the photometric data of the models and observations, respectively, and the shaded area corresponds to the 10th–90th percentile range.
Current usage metrics show cumulative count of Article Views (full-text article views including HTML views, PDF and ePub downloads, according to the available data) and Abstracts Views on Vision4Press platform.
Data correspond to usage on the plateform after 2015. The current usage metrics is available 48-96 hours after online publication and is updated daily on week days.
Initial download of the metrics may take a while.