Fig. 5
Download original image
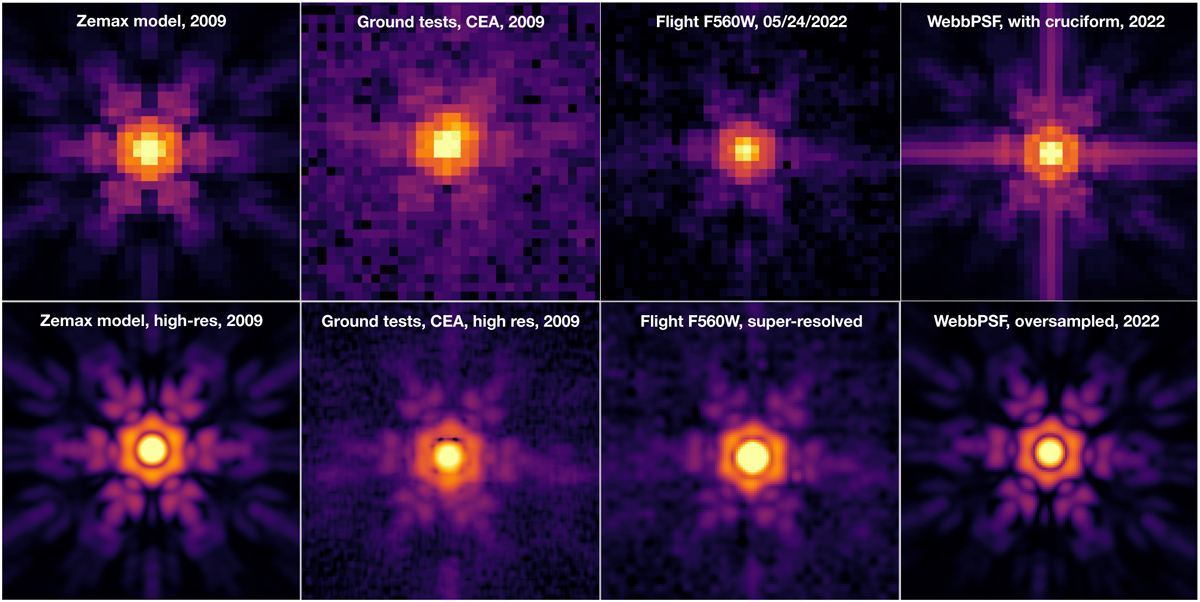
Stamps of the F560W PSF core (4" × 4" boxes), showing the Zemax simulations (1st column), the ground-based PSF tests done at CEA with the imager ETM in 2008–2009 (2nd column), the flight PSF commissioning data (3rd column), and the WebbPSF simulations computed during commissioning (last column). On the top right image, an approximate representation (exponential profile) of the cruciform was added on top of the WebbPSF model. All PSF images are shown on a log-scale, with same relative stretch, at the center of the imager field of view. The top row shows native resolution data with 0.11 arcsec pixel-1 scale. The bottom row shows super-resolved PSFs. The Zemax and WebbPSF high-resolution simulations, as well as the reconstructed image of the super-resolved flight and ground-based PSFs, are shown with an oversampling factor of 4. The base of the cruciform (cross aligned in horizontal X and vertical Y directions) is visible both on ground-based and flight images.
Current usage metrics show cumulative count of Article Views (full-text article views including HTML views, PDF and ePub downloads, according to the available data) and Abstracts Views on Vision4Press platform.
Data correspond to usage on the plateform after 2015. The current usage metrics is available 48-96 hours after online publication and is updated daily on week days.
Initial download of the metrics may take a while.