Fig. 22
Download original image
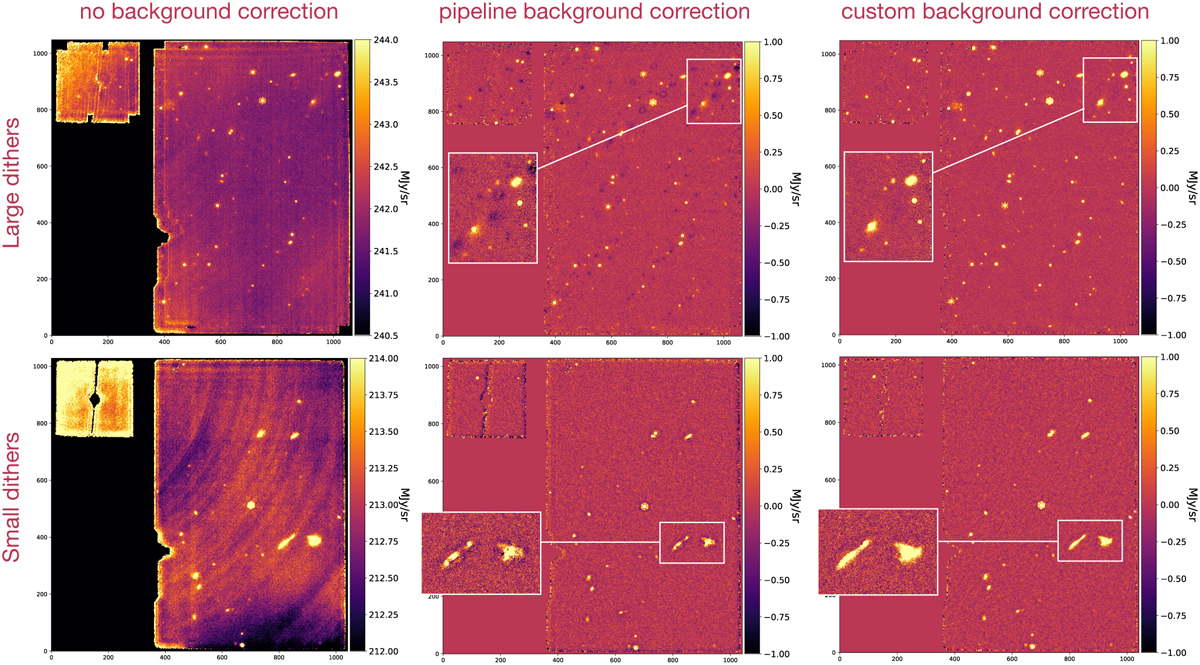
Demonstration of the effect of dither pattern size on the background subtraction in MIRI F2100W observations (top: PID 1024, bottom: PID 1028). First column shows the combined level 3 (i2d) image without background correction. Second and third columns show the background- subtracted combined level 3 images using the JWST pipeline (middle) and manually (right). In both cases the master background is constructed using individual science dithers, without dedicated background observations). The pipeline uses all the dithers and make a sigma-clipped meanstack, while in the manual method we exclude dithers that are close to each other and interpolate the source values with background from other dithers (see Sect. 10.2 for details). The manual (custom) background subtraction returns better results than that of the pipeline. However, both strategies fail as a good solution for observations with dithers smaller than ~1.5× FWHM. Background images constructed from such dithers have source residuals and over-subtract the flux of any source that is resolved. The inset panels are zoom-in examples for visual demonstration. The bottom left image shows arcs in the background across time image. These are referred to as “tree-rings” and can be seen in short wavelength – low background – data. They are a detector artefact and associated with the reset anomaly which is removed in pipeline dark subtraction (Morrison et al. 2023).
Current usage metrics show cumulative count of Article Views (full-text article views including HTML views, PDF and ePub downloads, according to the available data) and Abstracts Views on Vision4Press platform.
Data correspond to usage on the plateform after 2015. The current usage metrics is available 48-96 hours after online publication and is updated daily on week days.
Initial download of the metrics may take a while.