Open Access
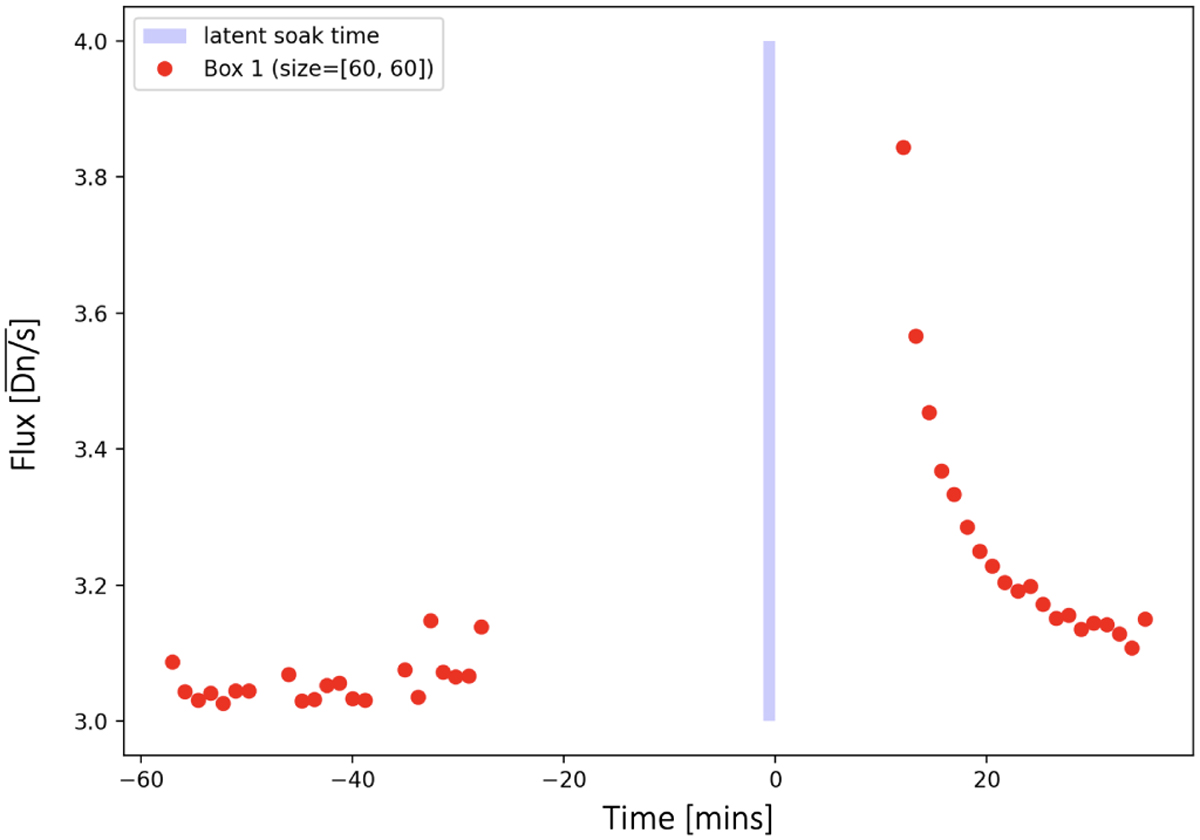
Fig. 18
Download original image
Flux (DN s−1) per integration of the background imaging observations taken before and after an observation a The time and duration of the 25.5 µm imaging observatio sented by the blue shaded region. The data displayed was processed to level 2a.
Current usage metrics show cumulative count of Article Views (full-text article views including HTML views, PDF and ePub downloads, according to the available data) and Abstracts Views on Vision4Press platform.
Data correspond to usage on the plateform after 2015. The current usage metrics is available 48-96 hours after online publication and is updated daily on week days.
Initial download of the metrics may take a while.