Fig. 16
Download original image
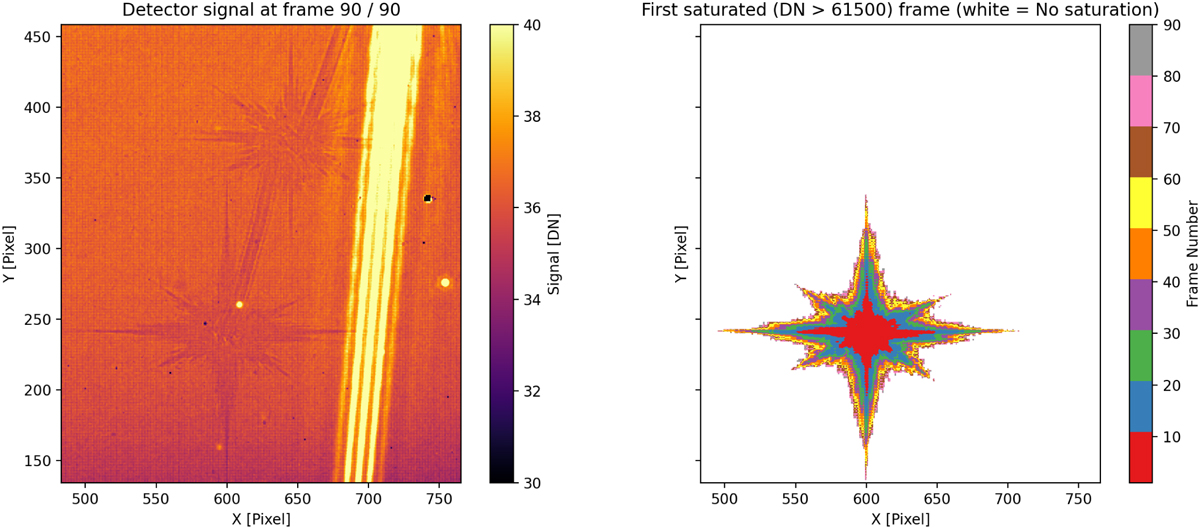
Left: image of β Dor at 10 µm at the position where the bright star was observed in the previous two observations at 5.6 and 7.7 µm. The persistence images of the star in the two positions can be seen in low contrast as well as that of the slew between positions. Right: identification of the pixels that are marked as “hard” saturated in the first position observation at 5.6 µm. We can see the persistence image matches well the image structure of the hard saturated pixels from the image.
Current usage metrics show cumulative count of Article Views (full-text article views including HTML views, PDF and ePub downloads, according to the available data) and Abstracts Views on Vision4Press platform.
Data correspond to usage on the plateform after 2015. The current usage metrics is available 48-96 hours after online publication and is updated daily on week days.
Initial download of the metrics may take a while.