Fig. 15
Download original image
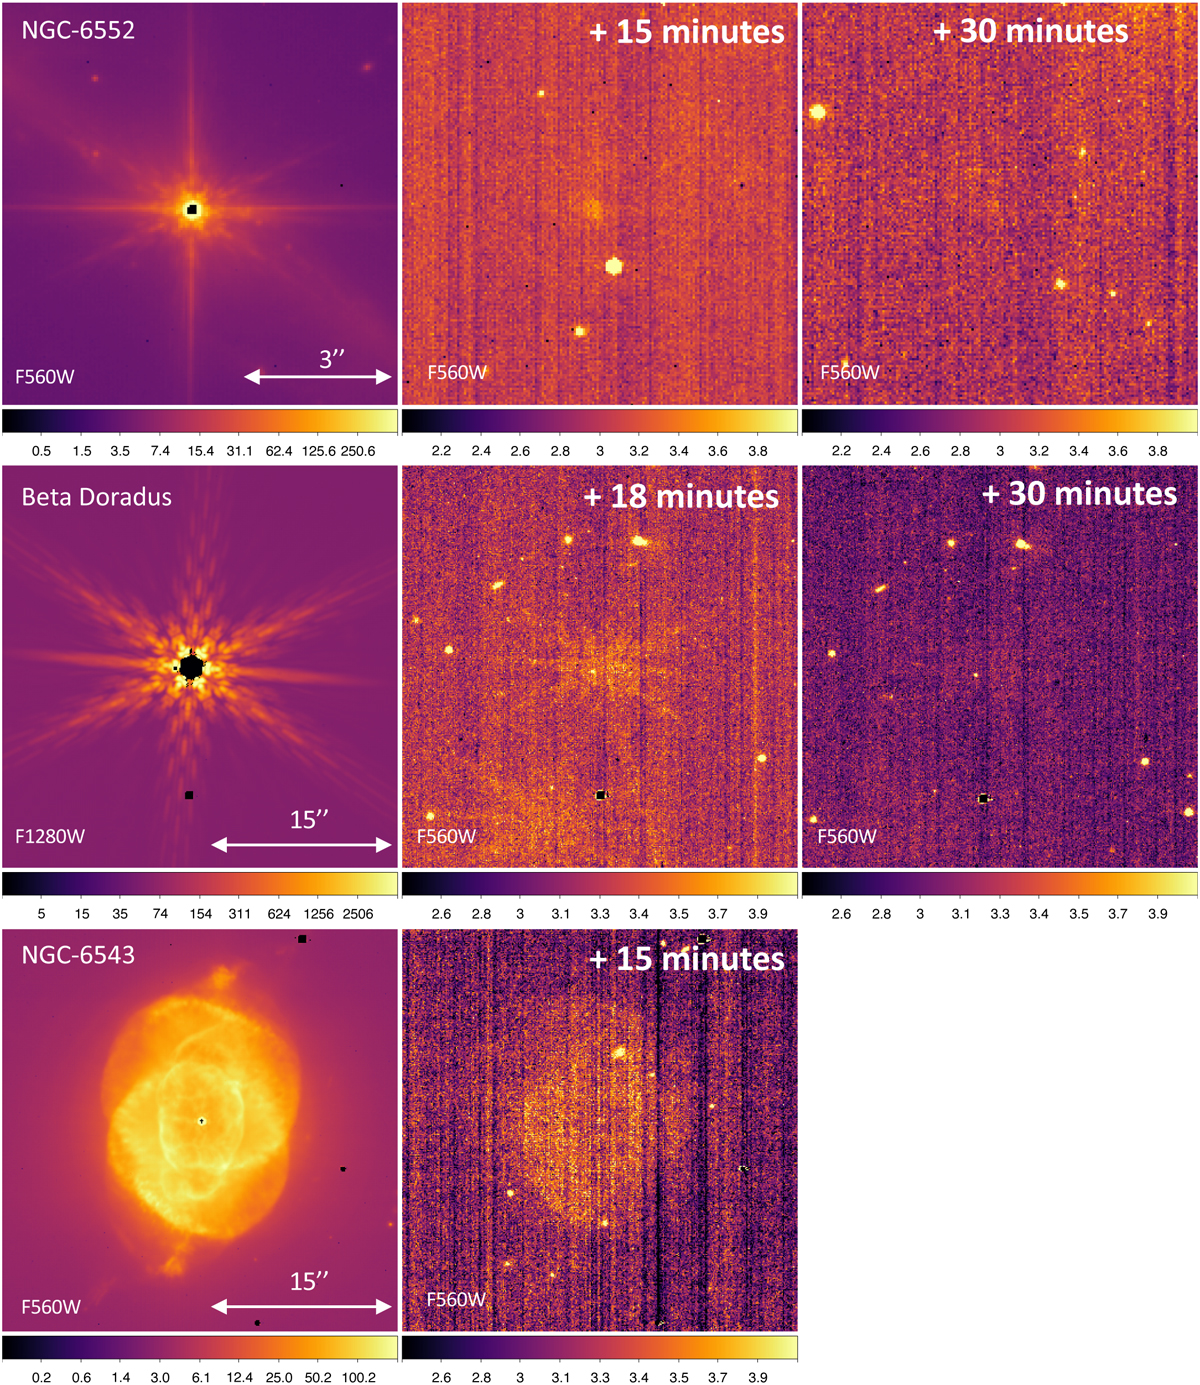
Examples of persistence in flux/rate images (pipeline level 2a). Top row shows results from the persistence test in PID 1039. Each row, left to right, shows the same position on the detector. Left: image of the Seyfert galaxy (NGC 6552, β Dor, or NGC 6543) that saturates the detector at its core. Centre: the next exposure taken 15 min after the first image – a faint persistence residual from the galaxy nucleus can just be seen in the image. Right: showing the same position 30 min after the first image was observed – the persistence residual is very faint. The images for β Dor are from PID 1023. The bottom row shows persistence from the extended structure of the bright planetary nebula NGC 6543. Note the scale for the soak images on the left is log while that for the other images is linear and all units are DN s−1.
Current usage metrics show cumulative count of Article Views (full-text article views including HTML views, PDF and ePub downloads, according to the available data) and Abstracts Views on Vision4Press platform.
Data correspond to usage on the plateform after 2015. The current usage metrics is available 48-96 hours after online publication and is updated daily on week days.
Initial download of the metrics may take a while.