Fig. 8
Download original image
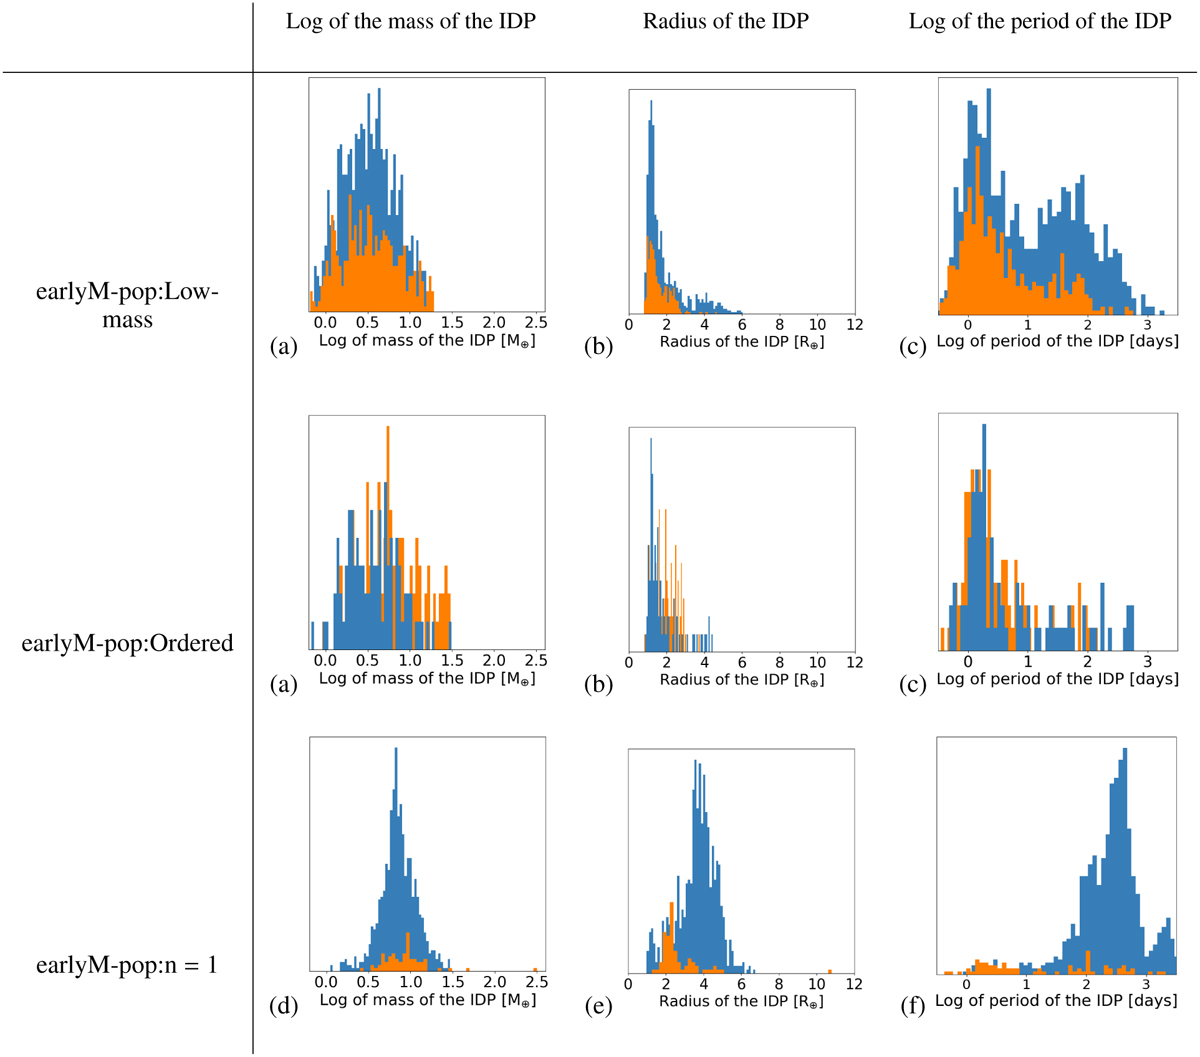
Figure equivalent to Fig. 7 for EarlyM-pop. The first, second, and third columns depict the repartition of IDPs’ masses (logarithm scale), radii, and periods (logarithm scale). Here, only the systems Low-mass (first line) and n = 1 (second line) systems are shown because the three other groups do not give informative insights. The blues bars refer to systems with one ELP or more, and the orange bars refer to systems without ELPs.
Current usage metrics show cumulative count of Article Views (full-text article views including HTML views, PDF and ePub downloads, according to the available data) and Abstracts Views on Vision4Press platform.
Data correspond to usage on the plateform after 2015. The current usage metrics is available 48-96 hours after online publication and is updated daily on week days.
Initial download of the metrics may take a while.