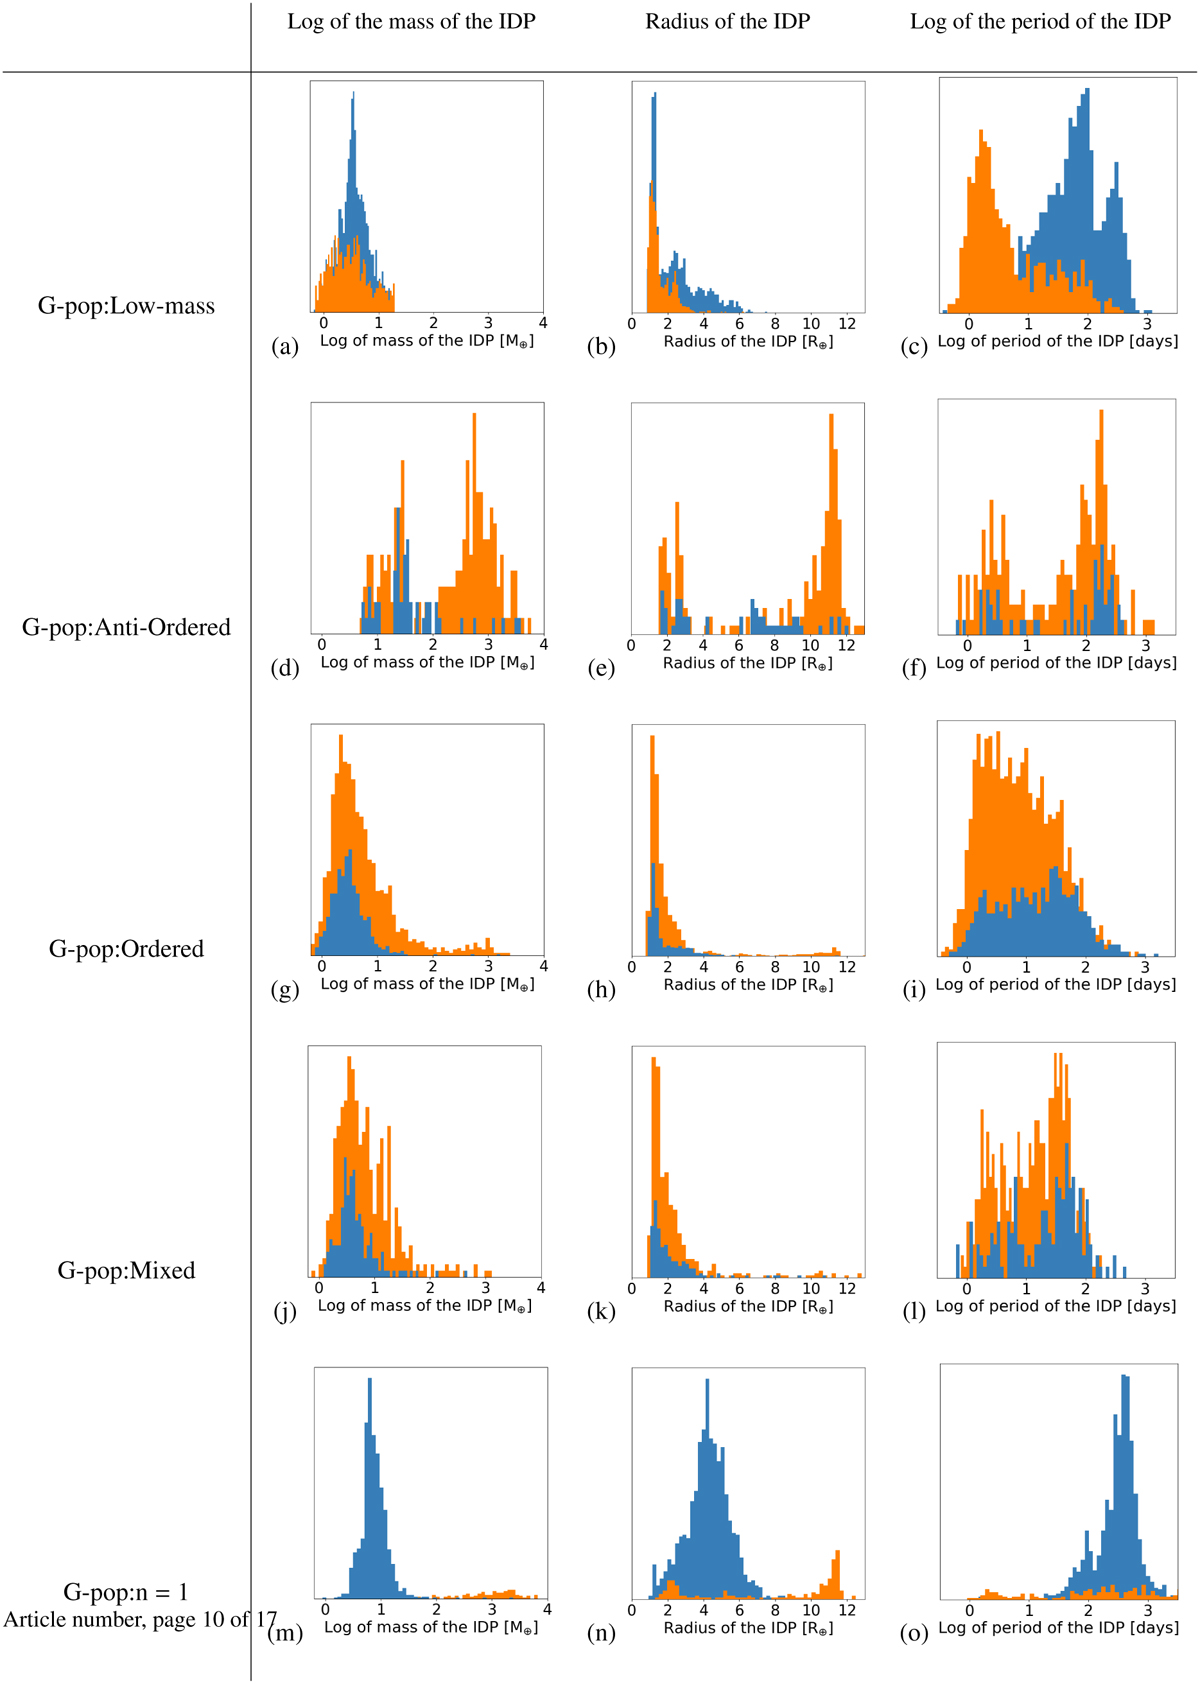
Fig. 7
Download original image
Histograms of distribution of IDPs’ properties among systems in G-pop for different biased architectures. The first column depicts the repartition of IDPs’ masses (logarithm scale), the second column shows the repartition of IDPs’ radii, and the third the repartition of IDPs’ periods (logarithm scale). Each line corresponds to a different group of biased architecture among the G-pop. The first line shows the IDPs’ properties in the Low-mass systems in G-pop, the second line the Anti-Ordered systems, third line is for the Ordered systems, fourth for Mixed systems, and fifth for the systems with only one visible planet (n = 1, in this case IDP refers to the only visible planet). The blues bars refer to systems with one ELP or more, and the orange bars refer to systems without ELPs.
Current usage metrics show cumulative count of Article Views (full-text article views including HTML views, PDF and ePub downloads, according to the available data) and Abstracts Views on Vision4Press platform.
Data correspond to usage on the plateform after 2015. The current usage metrics is available 48-96 hours after online publication and is updated daily on week days.
Initial download of the metrics may take a while.