Fig. 5
Download original image
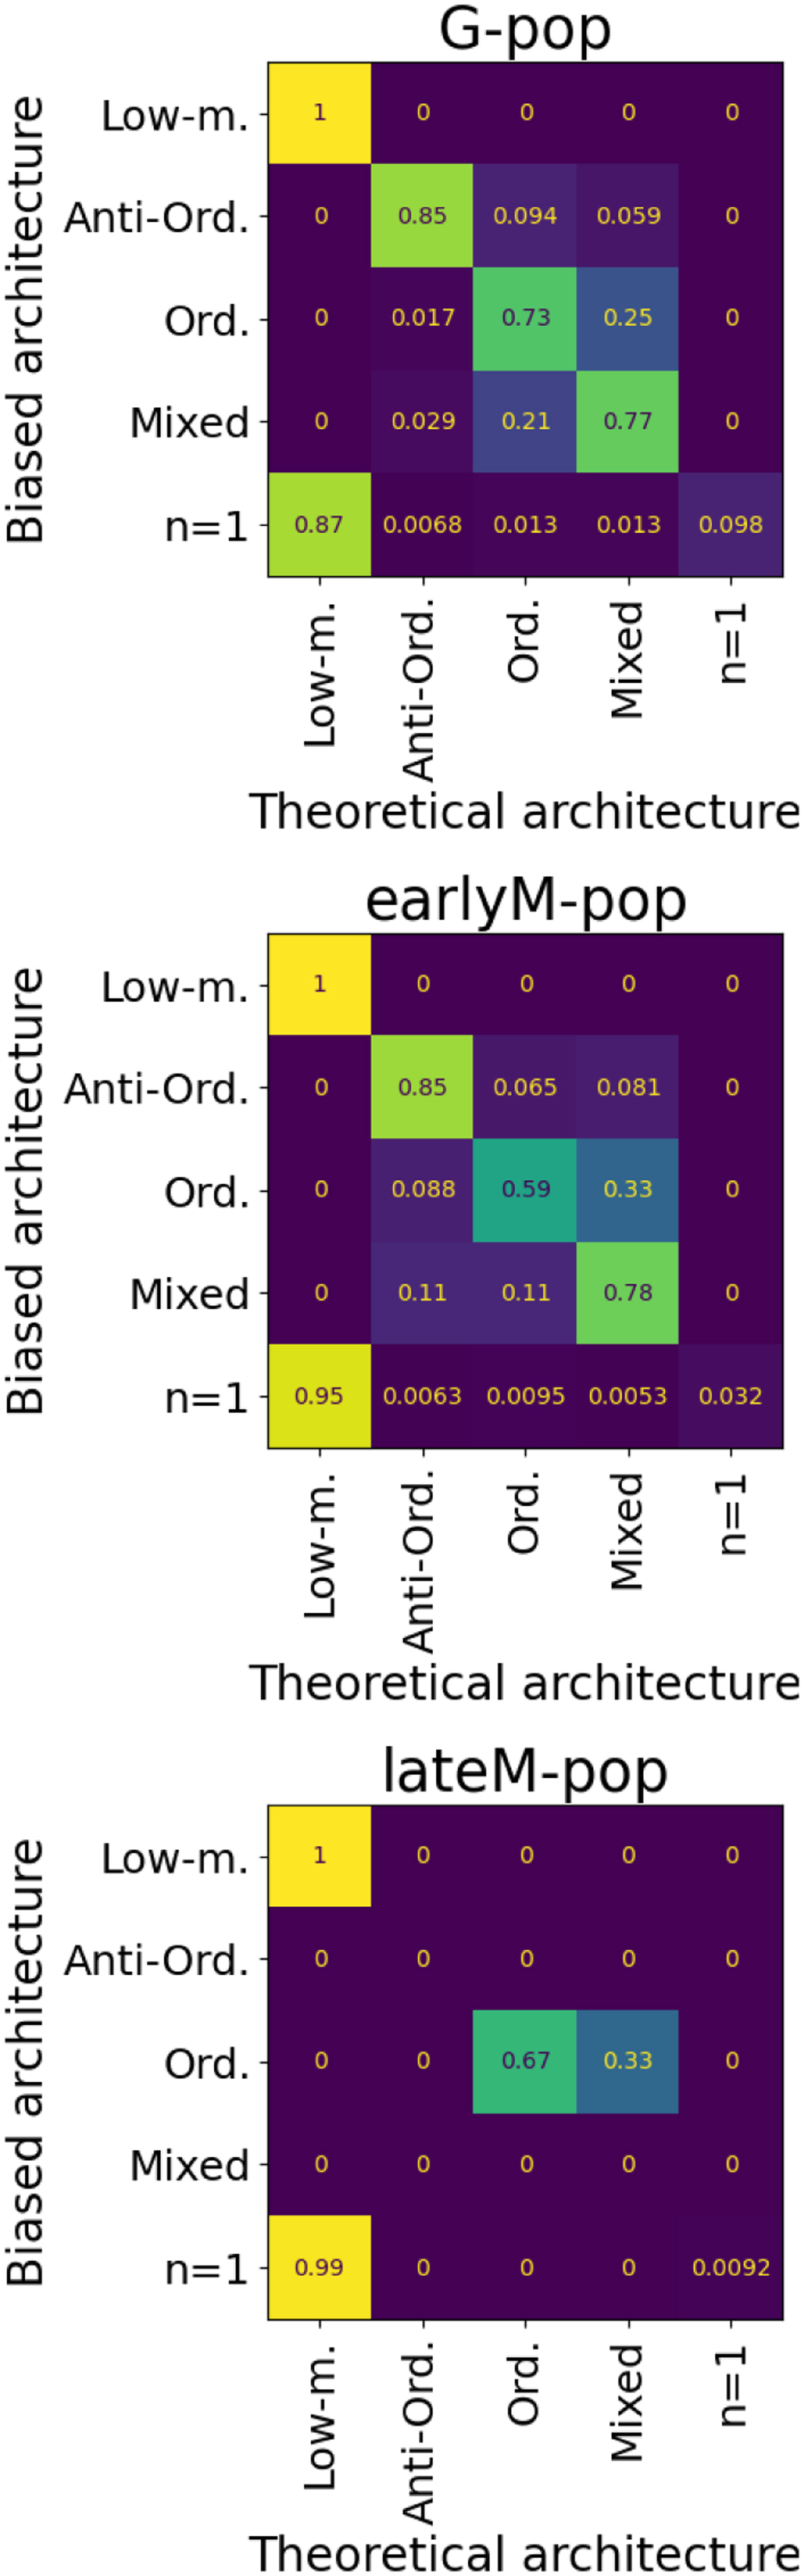
Confusion matrix representing the class change of each population with observational bias. The upper, middle, and lower panels represent the G-pop, earlyM-pop, and lateM-pop, respectively. The matrix is normalised on the biased architecture (lines). As an example, 85% of biased Anti-Ordered systems around G stars have an Anti-Ordered theoretical architecture.
Current usage metrics show cumulative count of Article Views (full-text article views including HTML views, PDF and ePub downloads, according to the available data) and Abstracts Views on Vision4Press platform.
Data correspond to usage on the plateform after 2015. The current usage metrics is available 48-96 hours after online publication and is updated daily on week days.
Initial download of the metrics may take a while.