Fig. 4
Download original image
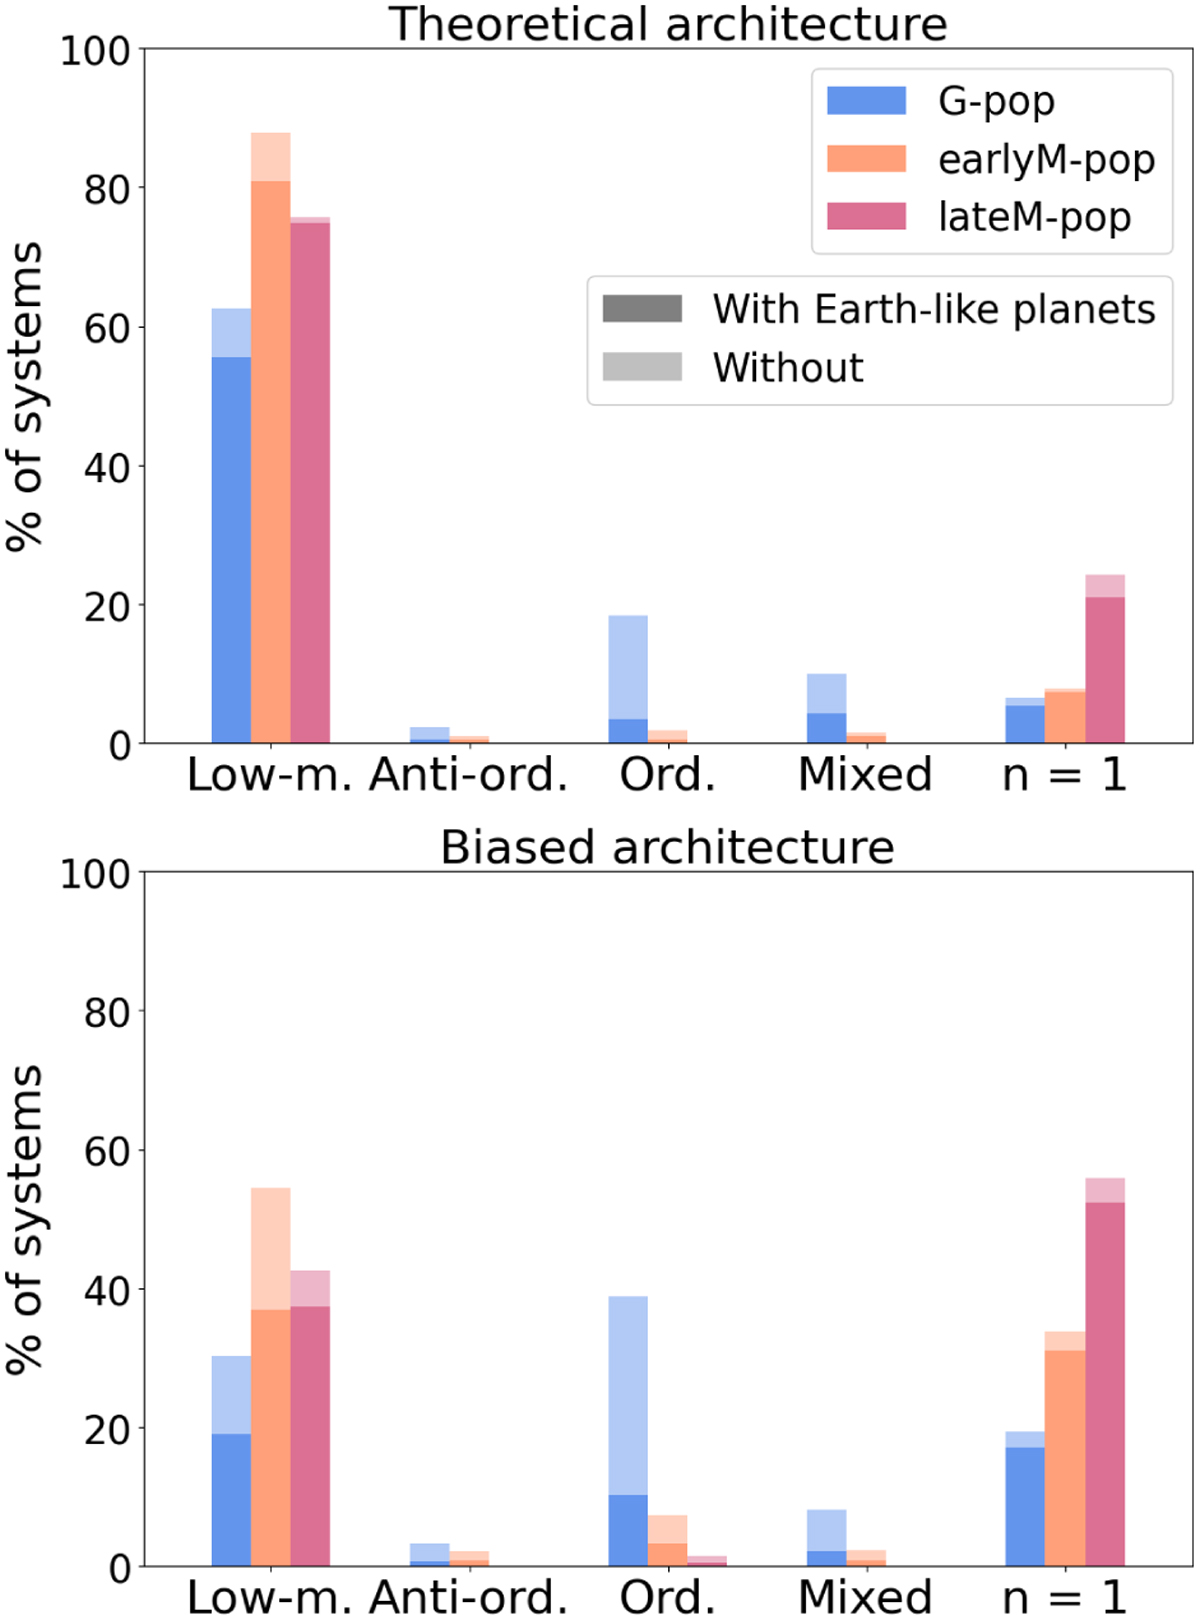
Distribution of the three populations in different architecture classes and proportion of systems with ELPs. The top panel shows theoretical architecture distribution, and the lower panel shows the distribution of biased architecture. The fully saturated colour bars represent the proportion of systems in each category with at least one ELP, and the greyed part represents the proportion of systems without ELP. There is, as an example, 63% of Low-mass systems around G stars, out of which 88% host an ELP.
Current usage metrics show cumulative count of Article Views (full-text article views including HTML views, PDF and ePub downloads, according to the available data) and Abstracts Views on Vision4Press platform.
Data correspond to usage on the plateform after 2015. The current usage metrics is available 48-96 hours after online publication and is updated daily on week days.
Initial download of the metrics may take a while.