Fig. 3.
Download original image
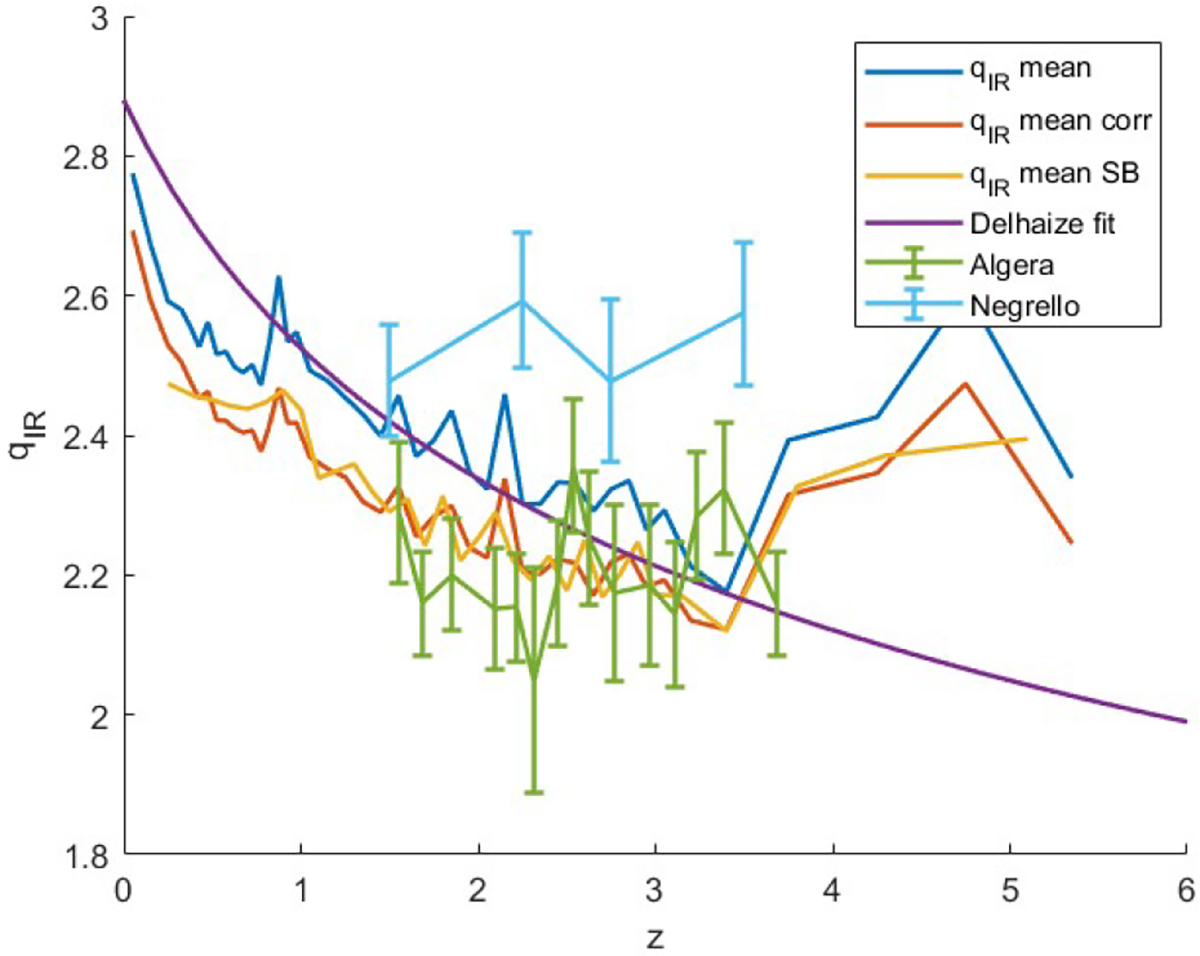
Redshift dependence of ![]() . The “qIR mean”, “qIR mean corr”, and “qIR mean SB” lines refer, respectively, to the initial Delhaize/MIGHTEE sample, the same sample but with S1.4 GHz flux densities and upper limits derived from the 3 GHz survey scaled up by a factor of 1.51, and to this latter sample after removing SMGs with SFR < 10 M⊙ yr−1 (“starburst plus protospheroid” sample). Error bars are omitted so as to avoid overcrowding. The “Delhaize fit” line shows the power-law fit,
. The “qIR mean”, “qIR mean corr”, and “qIR mean SB” lines refer, respectively, to the initial Delhaize/MIGHTEE sample, the same sample but with S1.4 GHz flux densities and upper limits derived from the 3 GHz survey scaled up by a factor of 1.51, and to this latter sample after removing SMGs with SFR < 10 M⊙ yr−1 (“starburst plus protospheroid” sample). Error bars are omitted so as to avoid overcrowding. The “Delhaize fit” line shows the power-law fit, ![]() , obtained by Delhaize et al. (2017). The results of our analysis of the Negrello et al. (2017) sample and of the study of Algera et al. (2020) are also shown.
, obtained by Delhaize et al. (2017). The results of our analysis of the Negrello et al. (2017) sample and of the study of Algera et al. (2020) are also shown.
Current usage metrics show cumulative count of Article Views (full-text article views including HTML views, PDF and ePub downloads, according to the available data) and Abstracts Views on Vision4Press platform.
Data correspond to usage on the plateform after 2015. The current usage metrics is available 48-96 hours after online publication and is updated daily on week days.
Initial download of the metrics may take a while.