Fig. 3.
Download original image
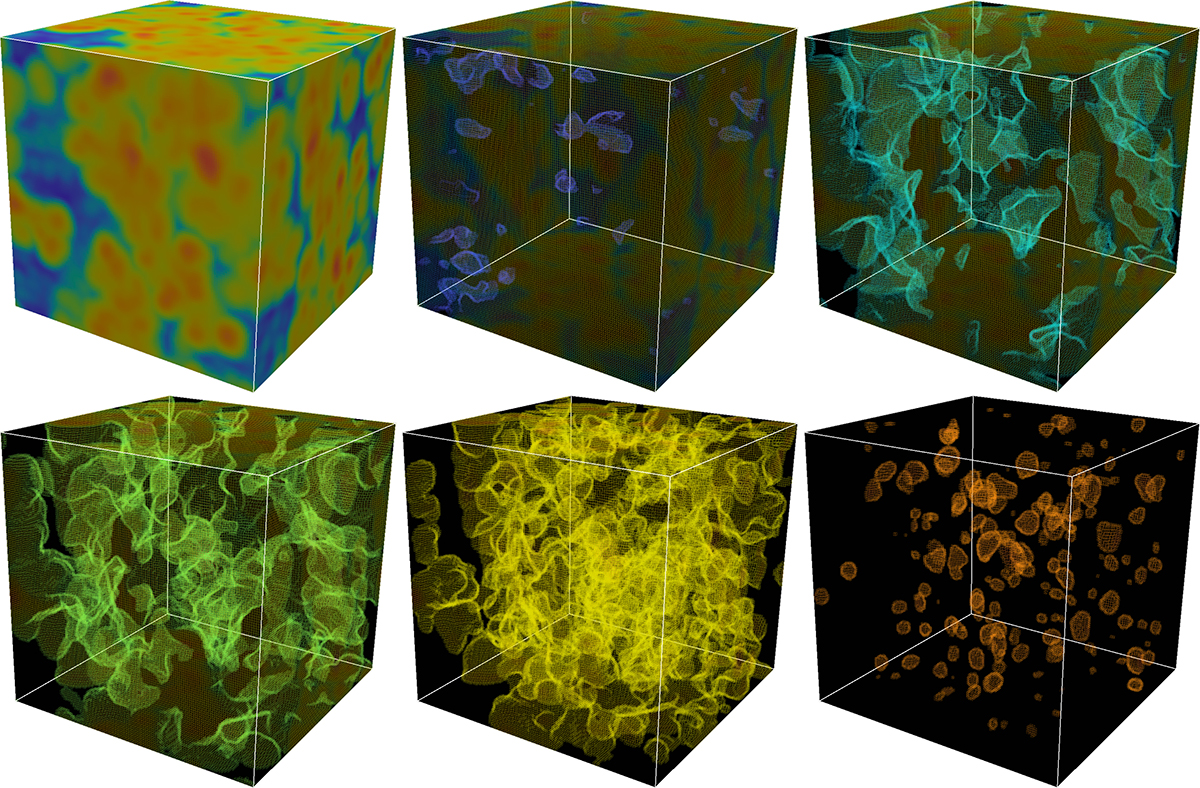
Excursion set of temperature map for the fiducial model at z = 0 for different values of the threshold: whole field (top left), T ≥ 7 × 10² K (top middle), T ≥ 104 K (top right), T ≥ 105 K (bottom left), T ≥ 106 K (bottom middle) and T ≥ 107 K (bottom right). As for Figure 2, these maps do not include the additional Gaussian smoothing of 1.56 h−1 Mpc and adopt the same colour code.
Current usage metrics show cumulative count of Article Views (full-text article views including HTML views, PDF and ePub downloads, according to the available data) and Abstracts Views on Vision4Press platform.
Data correspond to usage on the plateform after 2015. The current usage metrics is available 48-96 hours after online publication and is updated daily on week days.
Initial download of the metrics may take a while.