Fig. 9
Download original image
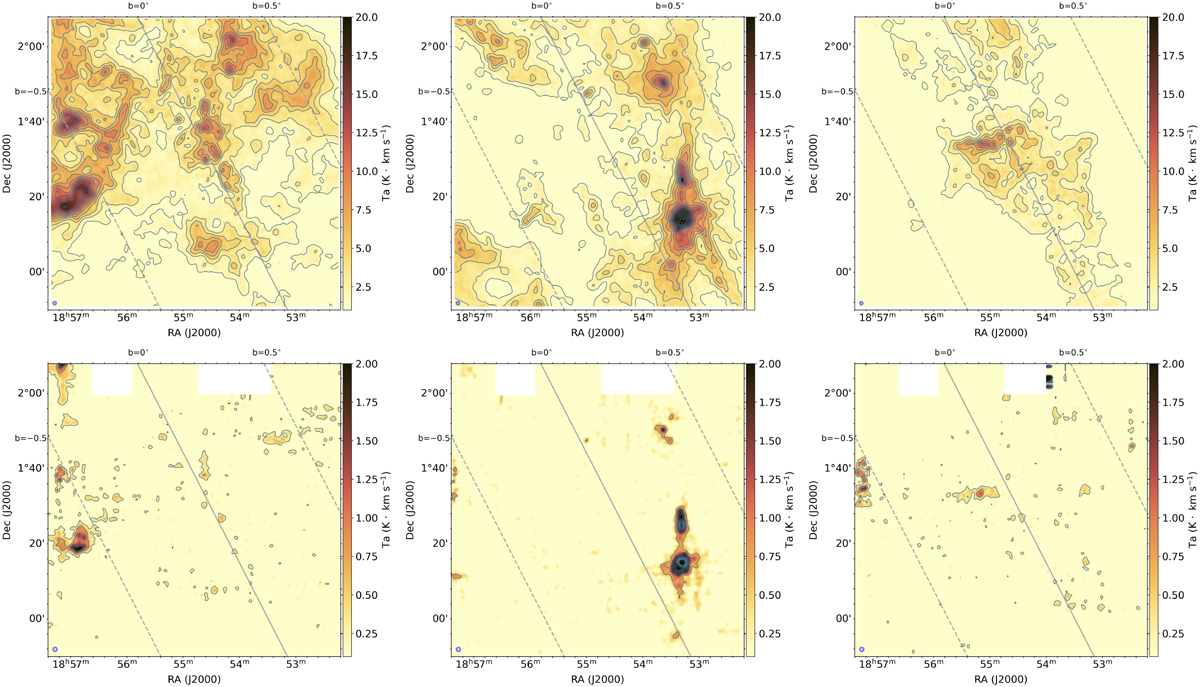
Comparison of CO and HNC emission in the field. Top left: velocity-integrated map of 13CO 1-0 from 40 to 52 km s−1. The contour levels are 5, 10, 15, 20, 25, 30, 35, 40, 45, 50, 60, 70, 80, 90, and 100σ, where σ is about 0.3 K km s−1. Top middle: velocity-integrated map of 13CO 1-0 from 53 to 62 km s−1. The contour levels are the same as in the top left. Top right: velocity-integrated map of 13CO 1-0 from 63 to 80 km s−1 with the same contour levels. Bottom left: velocity-integrated map of HNC 1-0 from 40 to 52 km s−1. The contour levels are 1, 3, 5, 7, and 9σ, where σ is about 0.25 K km s−1. Bottom middle: velocity-integrated map of HNC 1-0 from 53 to 62 km s−1. The contour levels are 3.0, 6.0, 9.0, 12.0, 15.0, 18.0, 21.0, 24.0, 27.0, and 30.0σ, where σ is 0.22 K km s−1. Bottom right: velocity-integrated map of HNC 1-0 from 63 to 80 km s−1. The contour levels are the same as in the bottom-left panel.
Current usage metrics show cumulative count of Article Views (full-text article views including HTML views, PDF and ePub downloads, according to the available data) and Abstracts Views on Vision4Press platform.
Data correspond to usage on the plateform after 2015. The current usage metrics is available 48-96 hours after online publication and is updated daily on week days.
Initial download of the metrics may take a while.