Fig. 4
Download original image
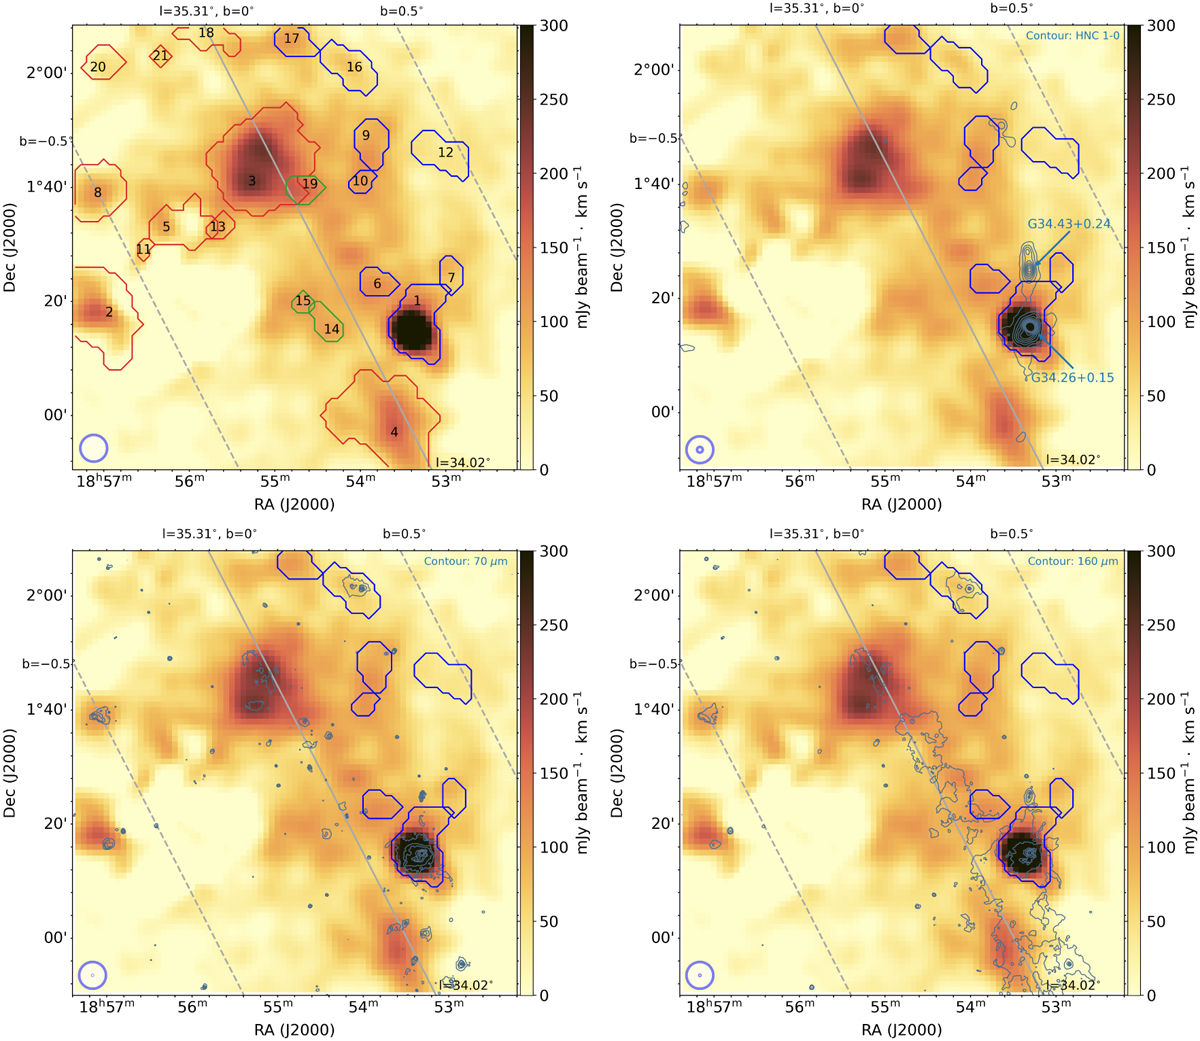
RRL clumps over RRL, HNC 1-0, and far-infrared maps. Top left: three groups of RRL clumps – within the Sagittarius-Carina arm (red), AqS (green), and off-arm near the Sagittarius-Carina arm (blue) – overlaid on a velocity-integrated intensity map of RRL from 0 to 120 km s−1. The beam size of FAST (![]() ) is presented as circle in the bottom-left corner. Top right: contour of the velocity-integrated intensity map of HNC 1-0 from 53 to 62 km s−1 on the RRL map. The contour levels are 3.0, 6.0, 9.0, 12.0, 15.0, 18.0, 21.0, 24.0, 27.0, and 30.0σ, where σ is 0.22 K km s−1. The beam of the Taeduk Radio Astronomy Observatory (TRAO) 14 m telescope for HNC 1-0 (57″) is presented as a small circle within that of the FAST beam. Bottom left: same as the top right but with 70 μm emission instead of HNC 1-0. The contour levels are 5, 12.5, 25, 125, 250, 500, and 1000 σ, where σ is 0.04 Jy pixel−1. The beam size of 70 μm (6″) emission is presented within the FAST beam. Bottom right: same as top right and bottom left, but with 160 μm emission. The contour levels are 5, 10, 50, 100, 200 and 400σ, where σ is 0.1 Jy pixel−1. The beam size of 160 μm (12′) emission is shown within the FAST beam.
) is presented as circle in the bottom-left corner. Top right: contour of the velocity-integrated intensity map of HNC 1-0 from 53 to 62 km s−1 on the RRL map. The contour levels are 3.0, 6.0, 9.0, 12.0, 15.0, 18.0, 21.0, 24.0, 27.0, and 30.0σ, where σ is 0.22 K km s−1. The beam of the Taeduk Radio Astronomy Observatory (TRAO) 14 m telescope for HNC 1-0 (57″) is presented as a small circle within that of the FAST beam. Bottom left: same as the top right but with 70 μm emission instead of HNC 1-0. The contour levels are 5, 12.5, 25, 125, 250, 500, and 1000 σ, where σ is 0.04 Jy pixel−1. The beam size of 70 μm (6″) emission is presented within the FAST beam. Bottom right: same as top right and bottom left, but with 160 μm emission. The contour levels are 5, 10, 50, 100, 200 and 400σ, where σ is 0.1 Jy pixel−1. The beam size of 160 μm (12′) emission is shown within the FAST beam.
Current usage metrics show cumulative count of Article Views (full-text article views including HTML views, PDF and ePub downloads, according to the available data) and Abstracts Views on Vision4Press platform.
Data correspond to usage on the plateform after 2015. The current usage metrics is available 48-96 hours after online publication and is updated daily on week days.
Initial download of the metrics may take a while.