Open Access
Fig. 10
Download original image
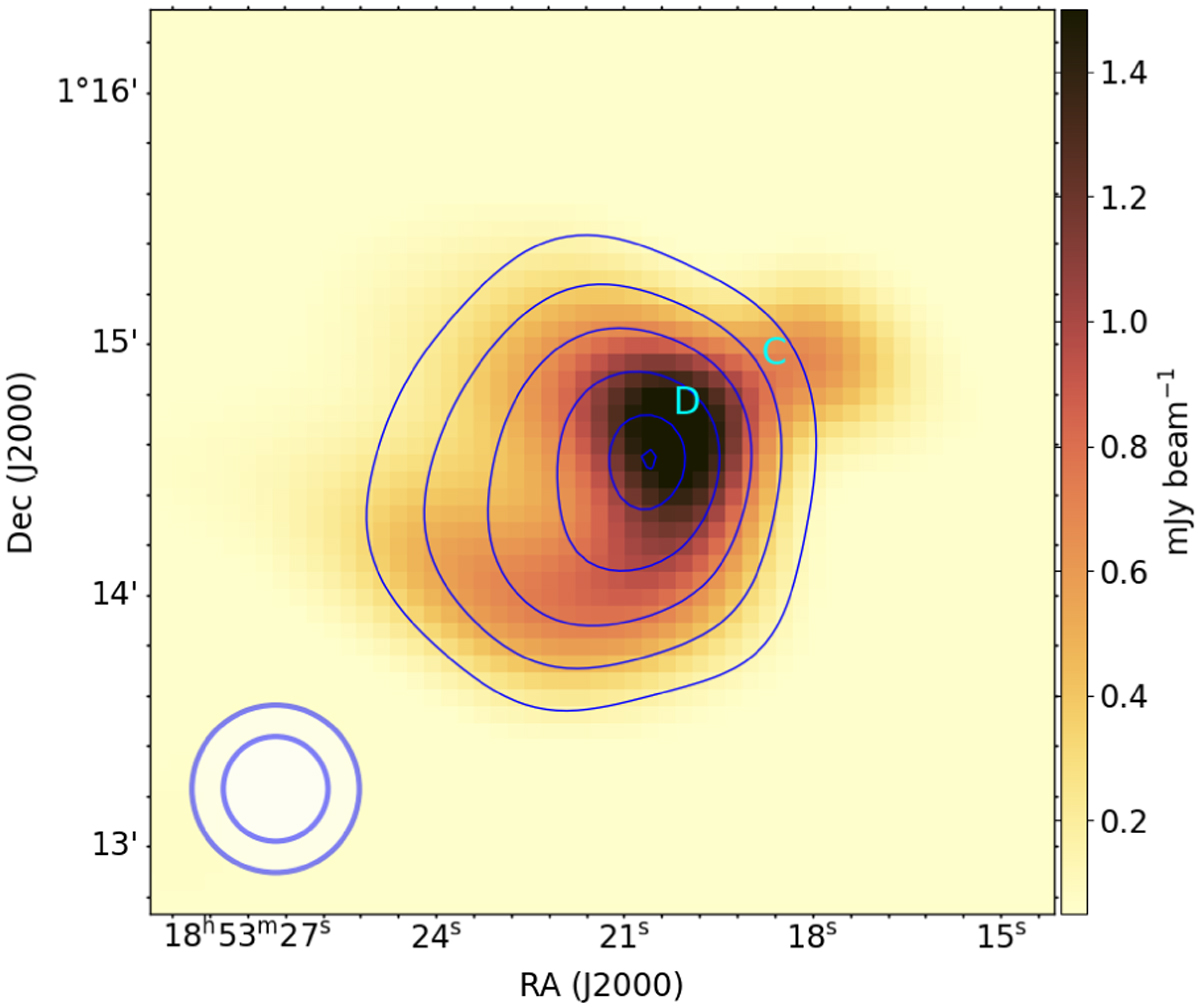
THOR continuum map (Beuther et al. 2016) near clump 1, overlaid with L-band RRL-integrated intensity contours. The contour levels are 10, 14, 18, 22, 25, and 26σ, where σ is about 100 mJy beam−1 km s−1. The beam sizes of the RRL (40″ × 40″) and continuum (25″ × 25″) are given in the bottom-left corner.
Current usage metrics show cumulative count of Article Views (full-text article views including HTML views, PDF and ePub downloads, according to the available data) and Abstracts Views on Vision4Press platform.
Data correspond to usage on the plateform after 2015. The current usage metrics is available 48-96 hours after online publication and is updated daily on week days.
Initial download of the metrics may take a while.