Fig. 1
Download original image
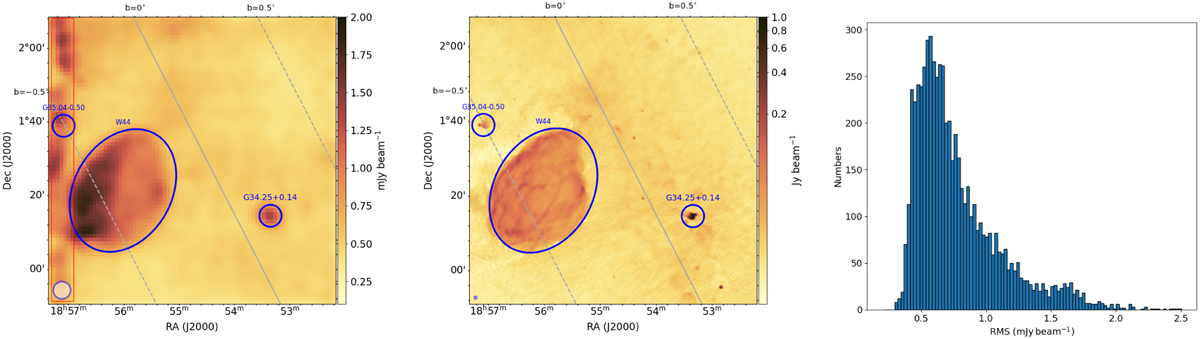
The RMS distribution. Left: RMS map of the observed area. Middle: L-band continuum emission in this region obtained with the THOR project and observed with the JVLA. Right: histogram of the spectral RMS noise. The RMS noise is calculated from the spectrum of each pixel using the line-free channels from −300 to −100 km s−1 with a resolution of 0.5 km s−1. On the RMS map, there are three strong continuum sources (in blue) that introduce high RMS noise. The high noise level in the red region on the left side edge is due to incomplete observing coverage and thus a lack of sampling. The RMS histogram shows that the mode of the noise distribution is about 0.6 mJy beam−1.
Current usage metrics show cumulative count of Article Views (full-text article views including HTML views, PDF and ePub downloads, according to the available data) and Abstracts Views on Vision4Press platform.
Data correspond to usage on the plateform after 2015. The current usage metrics is available 48-96 hours after online publication and is updated daily on week days.
Initial download of the metrics may take a while.