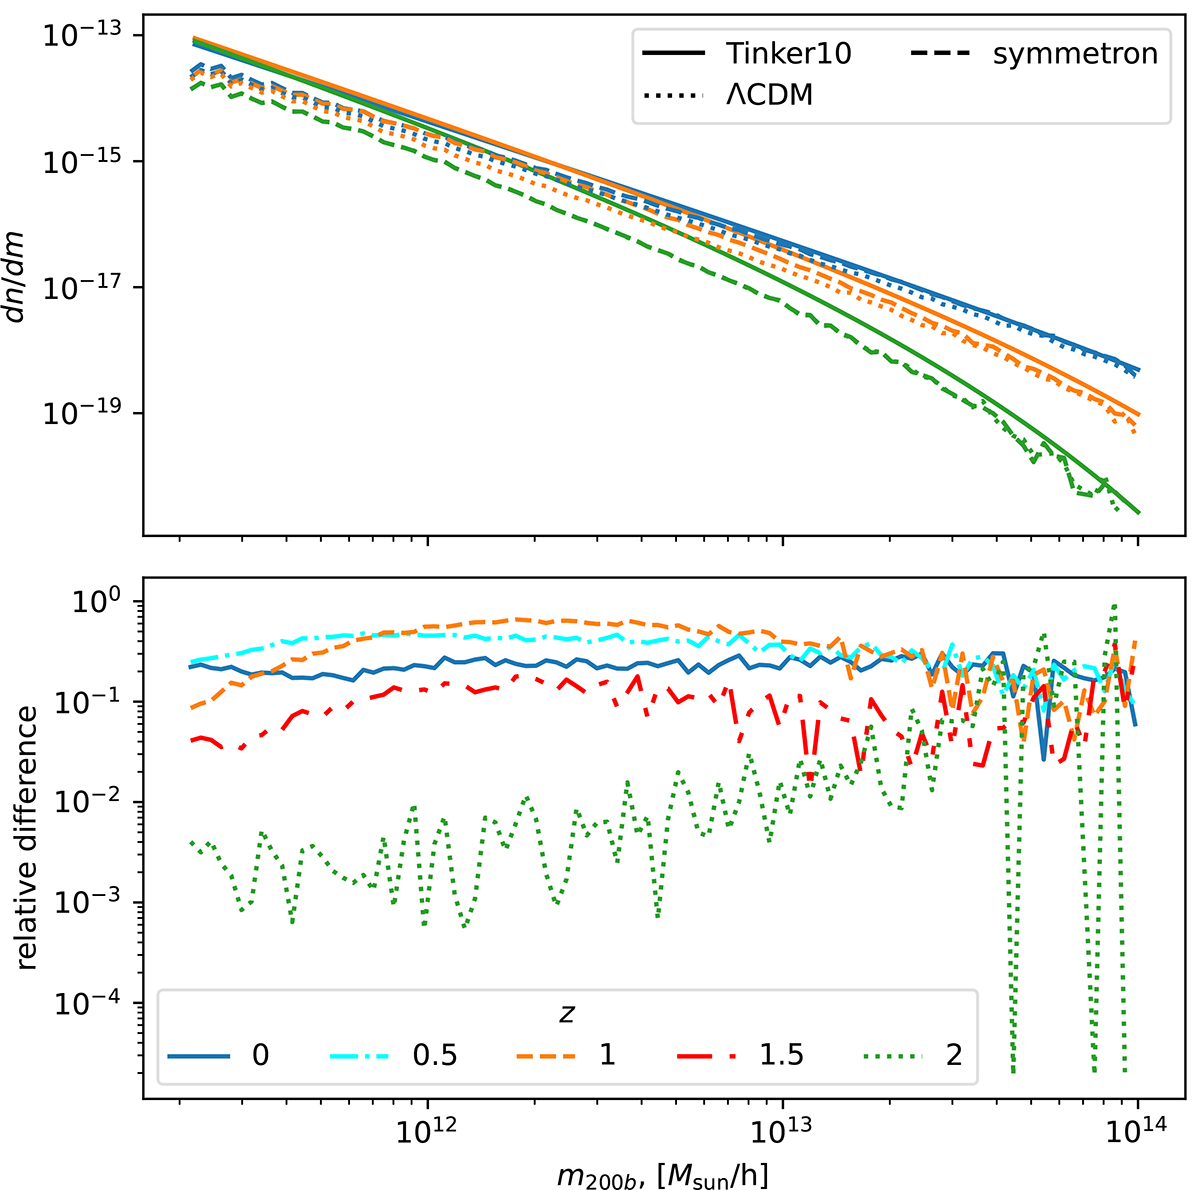
Fig. 14.
Download original image
HMFs as a function of halo mass m200b in units of solar masses Msun/h of the different simulations. Top: model I HMFs shown for three different redshifts z = 2, 1, 0. The HMFs are plotted as dashed lines, compared with the analytic Tinker10 model for ΛCDM using the CLASS spectra as a solid line, and the result of the ΛCDM simulation as a dotted lines. Bottom: relative differences of the HMFs compared to their ΛCDM counterparts.
Current usage metrics show cumulative count of Article Views (full-text article views including HTML views, PDF and ePub downloads, according to the available data) and Abstracts Views on Vision4Press platform.
Data correspond to usage on the plateform after 2015. The current usage metrics is available 48-96 hours after online publication and is updated daily on week days.
Initial download of the metrics may take a while.