Fig. 12.
Download original image
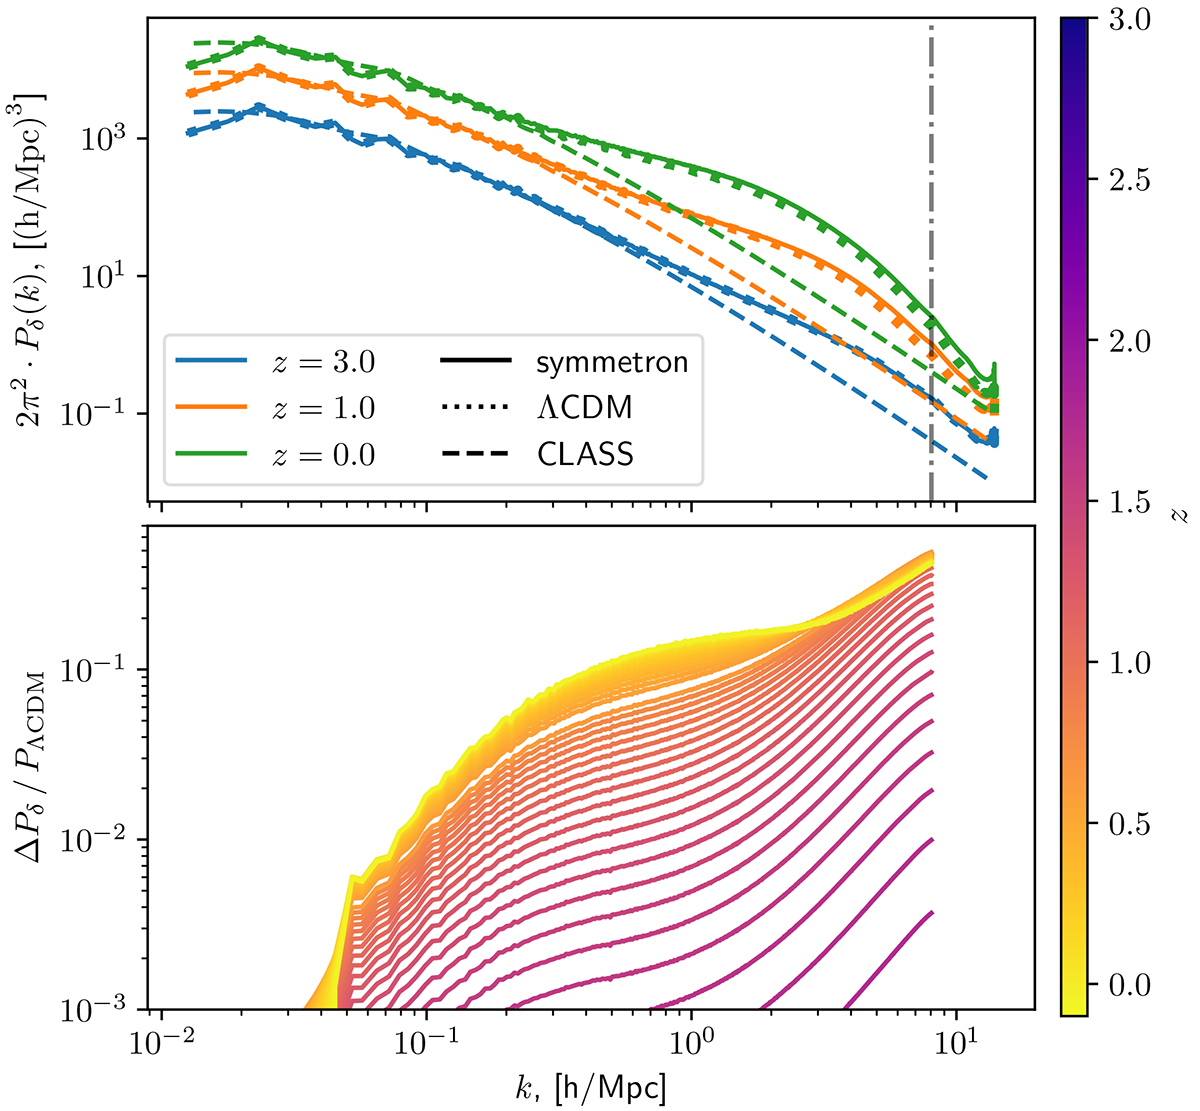
Matter power spectra for model I as a function of wavenumber k indicated for different redshifts z. Top: overlaid power spectra from the symmetron asevolution simulation plotted as a solid line, and the corresponding ΛCDM simulation is shown as dots. The CLASS power spectrum for the same ΛCDM parameters is shown as a dashed line. Bottom: relative difference with respect to ΛCDM of the power spectra from redshift z = 3 to z = 0 indicated in graded colours from blue to yellow. The gap in the spectra in the lower panel is not a physical feature and is caused by a typo in the settings file of the simulation. This caused two spectra to be skipped.
Current usage metrics show cumulative count of Article Views (full-text article views including HTML views, PDF and ePub downloads, according to the available data) and Abstracts Views on Vision4Press platform.
Data correspond to usage on the plateform after 2015. The current usage metrics is available 48-96 hours after online publication and is updated daily on week days.
Initial download of the metrics may take a while.