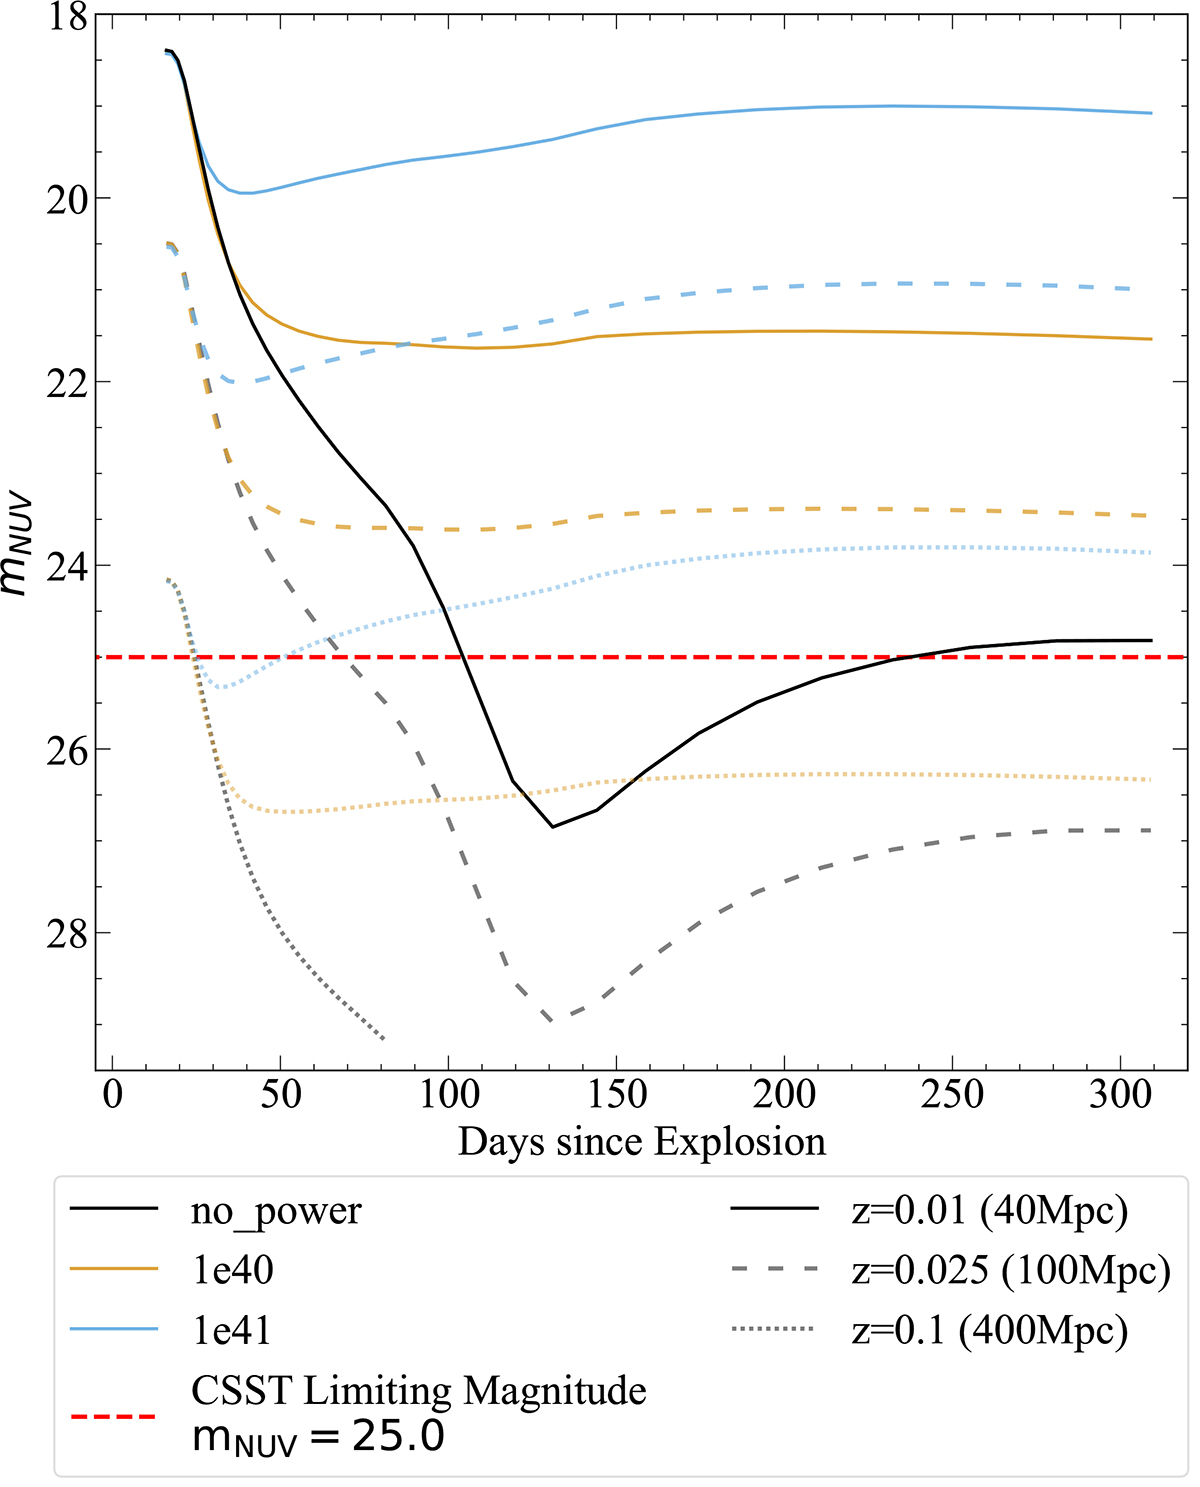
Fig. 4.
Download original image
Apparent NUV magnitude evolution of model nopwr, Pwr1e40 and Pwr1e41 of Dessart & Hillier (2022). The solid lines represent light curves at a distance of z = 0.01 (∼40 Mpc), the dashed thin lines represent light curves at z = 0.025 (∼100 Mpc) and the dotted lines represent light curves at z = 0.1 (∼400 Mpc). The red dashed thick line represents the limiting magnitude of a 2 × 150 s exposure in NUV band for CSST.
Current usage metrics show cumulative count of Article Views (full-text article views including HTML views, PDF and ePub downloads, according to the available data) and Abstracts Views on Vision4Press platform.
Data correspond to usage on the plateform after 2015. The current usage metrics is available 48-96 hours after online publication and is updated daily on week days.
Initial download of the metrics may take a while.