Open Access
Fig. 3.
Download original image
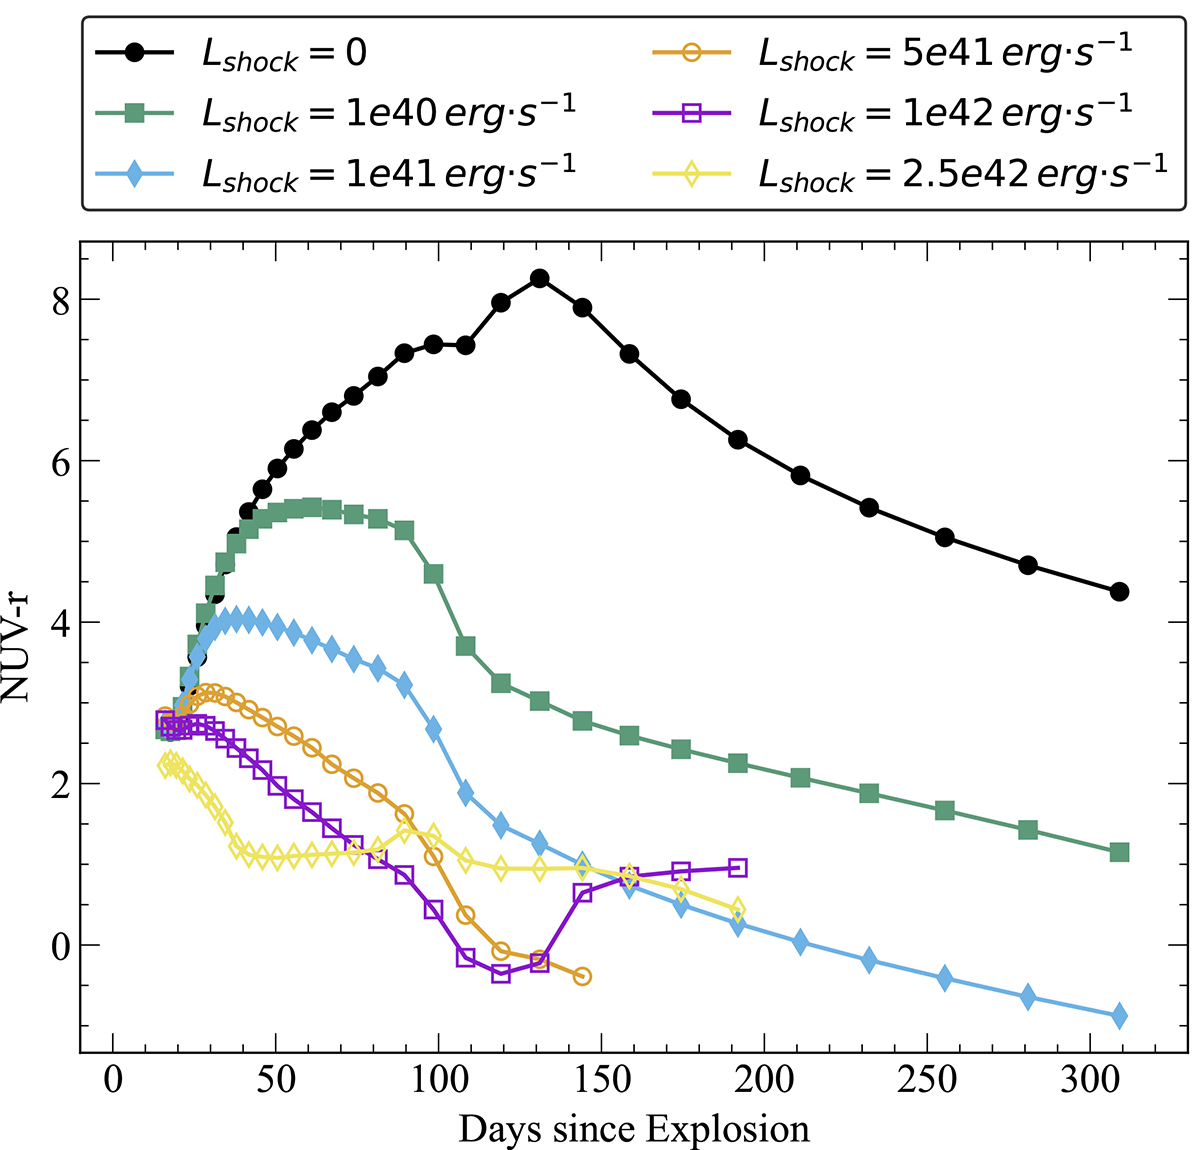
NUV − r color evolution of different ejecta-wind interaction models of Dessart & Hillier (2022). Each line corresponds to a different ejecta-wind interaction power injected into the model, denoted as different values of Lshock. The models with higher interaction power exhibit significantly bluer color.
Current usage metrics show cumulative count of Article Views (full-text article views including HTML views, PDF and ePub downloads, according to the available data) and Abstracts Views on Vision4Press platform.
Data correspond to usage on the plateform after 2015. The current usage metrics is available 48-96 hours after online publication and is updated daily on week days.
Initial download of the metrics may take a while.