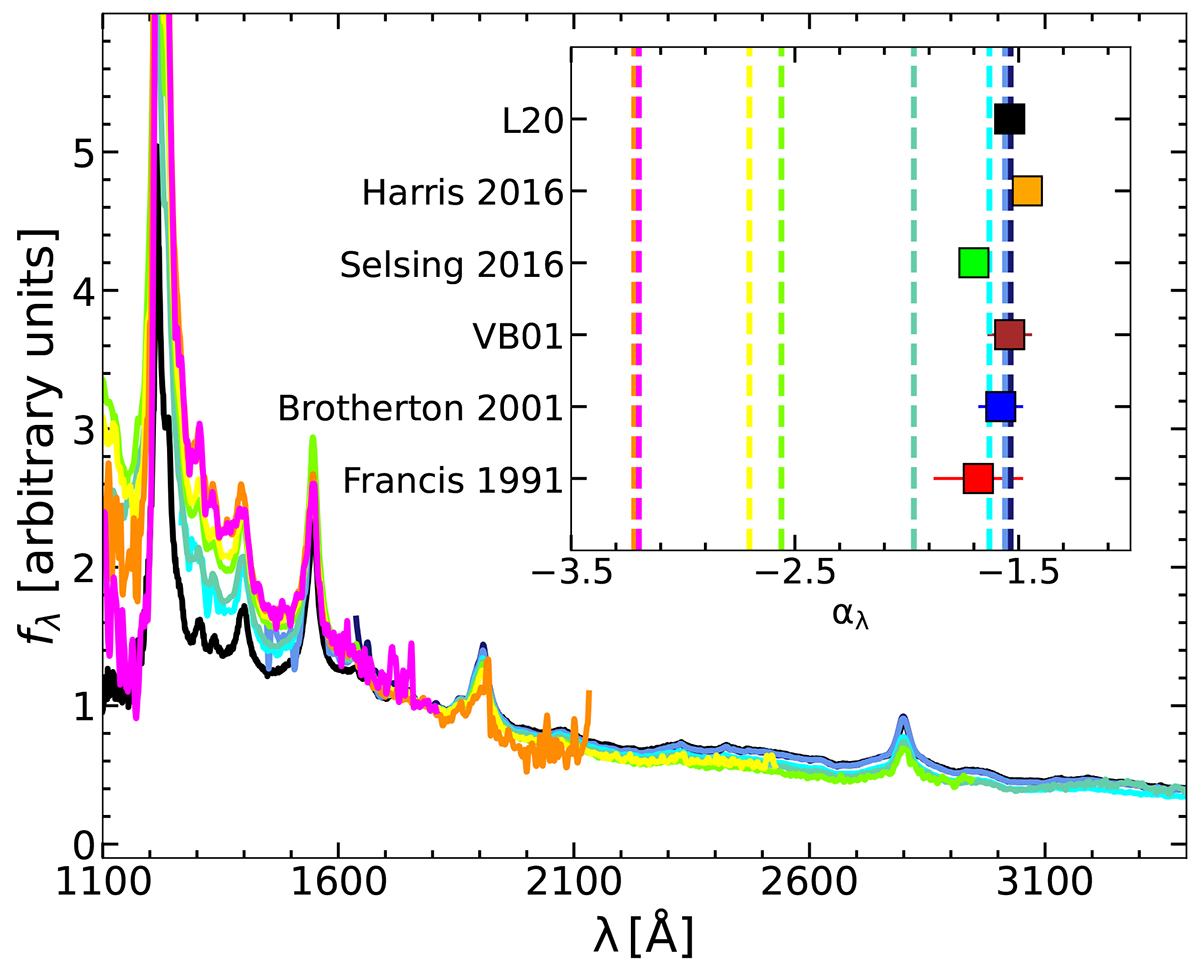
Fig. 7.
Download original image
De-reddened stacks, according to the same colour code as in Fig. 13, scaled by their mean emission between 1770 Å and 1810 Å. For comparison, the VB01 template is also shown in black as an external reference, rather than the usual L20 template. The rising continuum slopes with increasing redshift (and extinction) are clearly observed. Inset: UV continuum slopes of the literature samples described in Section 4.1 and plotted in Fig. 4 (squares), against the slopes of the de-reddened spectra (dashed lines).
Current usage metrics show cumulative count of Article Views (full-text article views including HTML views, PDF and ePub downloads, according to the available data) and Abstracts Views on Vision4Press platform.
Data correspond to usage on the plateform after 2015. The current usage metrics is available 48-96 hours after online publication and is updated daily on week days.
Initial download of the metrics may take a while.