Fig. 5.
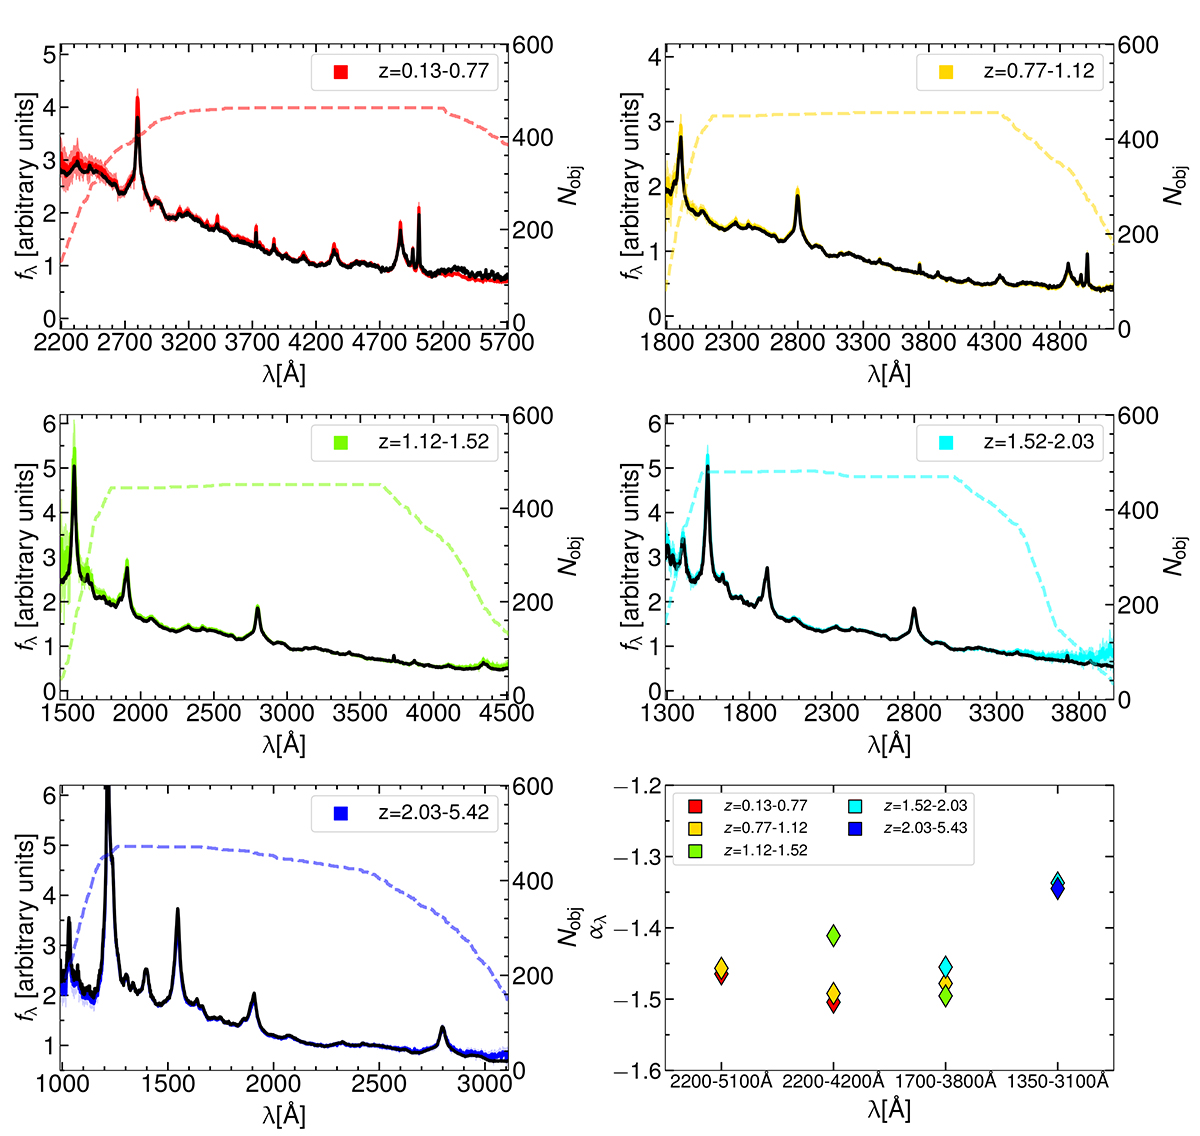
Download original image
Composite spectra divided in redshift bins superimposed to the full sample composite. The dashed line denotes the number of objects contributing to the stack in each spectral channel. The composite spectra in each bin are scaled to match the template respectively at 4200 Å for the low redshift bin, 3000 Å for the z = [0.77 − 1.12), z = [1.12 − 1.52), z = [1.52 − 2.03) bins, and 2200 Å for the highest redshift bin. In the bottom-right panel we show the slopes of the continuum evaluated in different pairs of continuum windows, which are generally consistent.
Current usage metrics show cumulative count of Article Views (full-text article views including HTML views, PDF and ePub downloads, according to the available data) and Abstracts Views on Vision4Press platform.
Data correspond to usage on the plateform after 2015. The current usage metrics is available 48-96 hours after online publication and is updated daily on week days.
Initial download of the metrics may take a while.