Open Access
Fig. G.1.
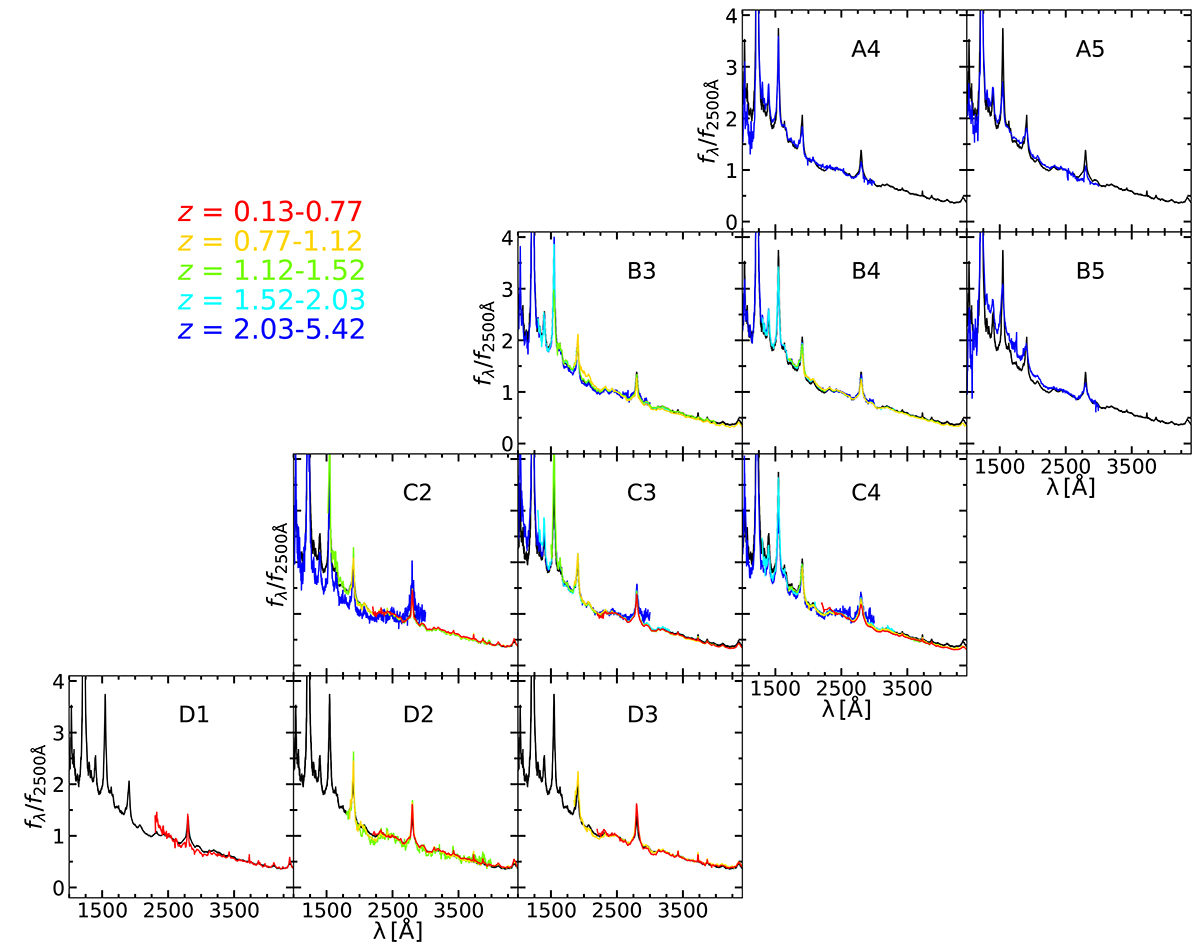
Download original image
Similarity of the stacked spectra across the parameter space. All the spectra are normalised by their average emission between 2490–2510 Å. The black spectrum represents the average spectrum of our full sample. Only spectra of the bins meeting the representativeness criterion are included in the plot.
Current usage metrics show cumulative count of Article Views (full-text article views including HTML views, PDF and ePub downloads, according to the available data) and Abstracts Views on Vision4Press platform.
Data correspond to usage on the plateform after 2015. The current usage metrics is available 48-96 hours after online publication and is updated daily on week days.
Initial download of the metrics may take a while.