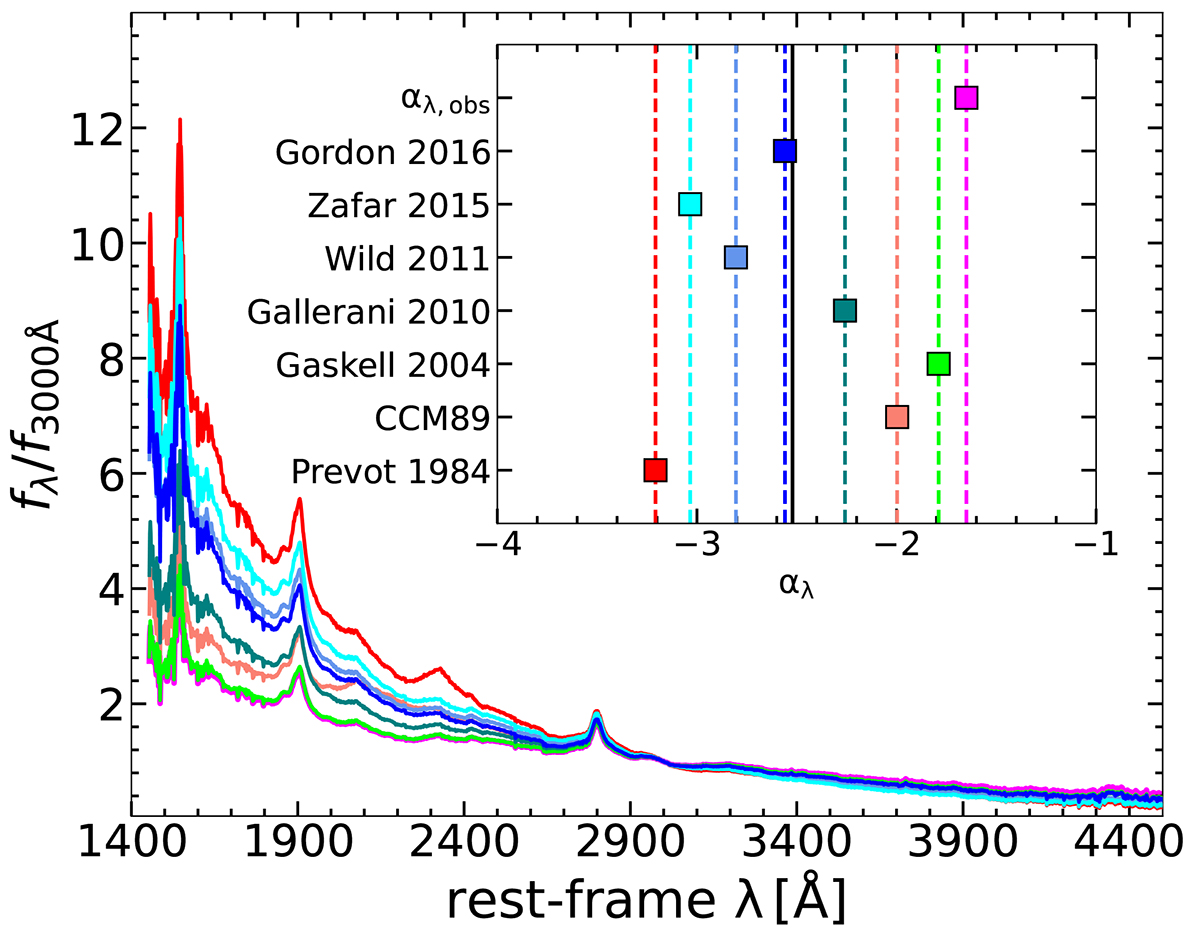
Fig. C.1.
Download original image
Test-bin composite spectrum de-reddened according to different extinction curves reported in the inset and assuming E(B − V) = 0.1 and RV = 3.1. The slopes produced from the spectral fits according to the different extinction curves are represented in the inset. The spectrum and the slope of the continuum before the de-reddening (αλ, obs) are reported in magenta as references. The slope derived assuming the extinction curve from Gordon et al. (2016) is the closest to the average (black line).
Current usage metrics show cumulative count of Article Views (full-text article views including HTML views, PDF and ePub downloads, according to the available data) and Abstracts Views on Vision4Press platform.
Data correspond to usage on the plateform after 2015. The current usage metrics is available 48-96 hours after online publication and is updated daily on week days.
Initial download of the metrics may take a while.