Fig. 14.
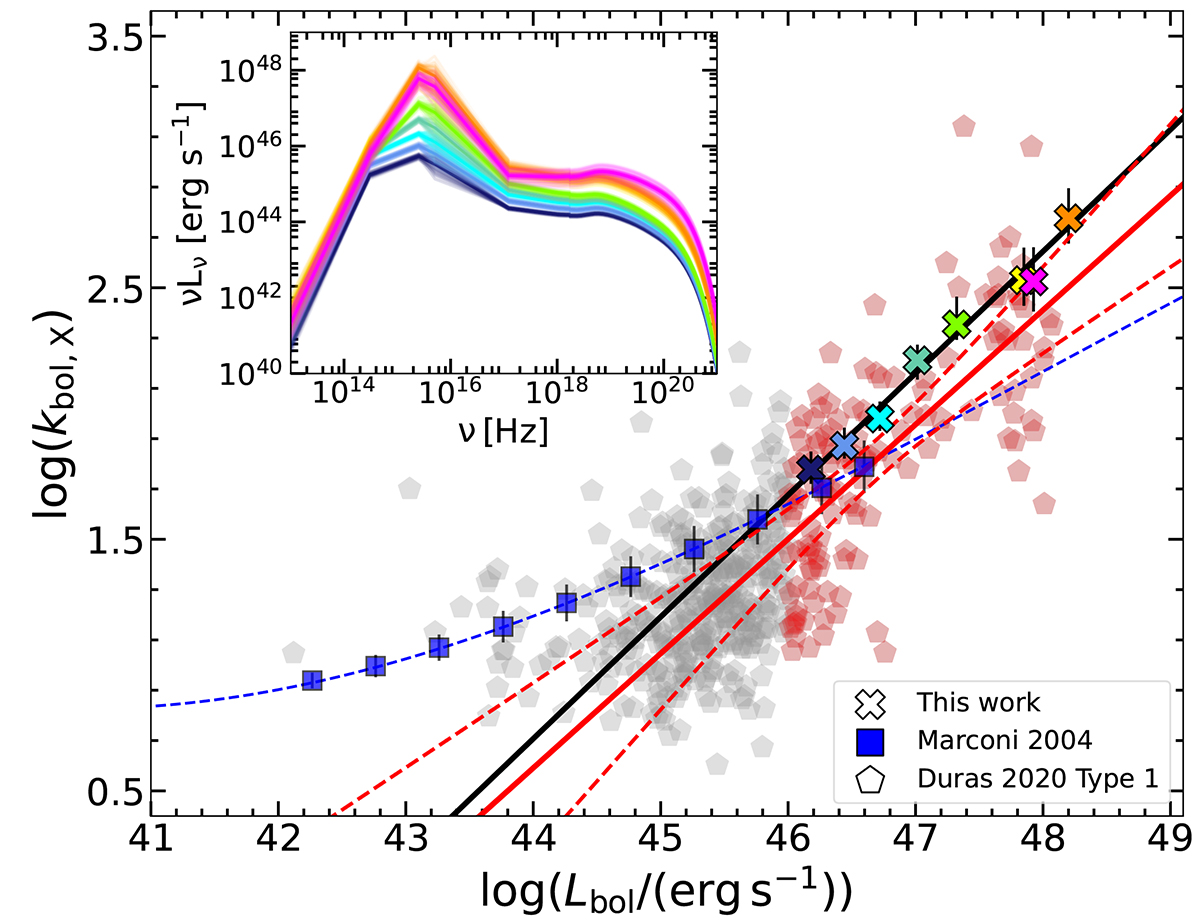
Download original image
Average hard X-ray bolometric corrections in each redshift bin. As a term of comparison, we report the kbol, X for the semi-analytical SED templates from M04 (blue squares) and the empirical ones from D20 (pentagons). The blue dashed line represents the best-fit reported in M04. Black and red continuous lines show, respectively, the best fit of our sample and the D20 objects in the high Lbol (≥1046 erg s−1) regime. The red dashed lines represent the 95% confidence interval of the best-fit regression line for the selected high-luminosity objects from D20 (red pentagons). Our values of kbol, X from the high-redshift, de-reddened SEDs are inconsistent with the extrapolation of the lower luminosity trend from M04, and steadily offset with respect to our best fit of the D20 high-luminosity type-1 quasars. Inset: average SEDs in each redshift bin, according to the same colour code as in Fig. 13. The shaded area is given by the individual mock SEDs in each bin.
Current usage metrics show cumulative count of Article Views (full-text article views including HTML views, PDF and ePub downloads, according to the available data) and Abstracts Views on Vision4Press platform.
Data correspond to usage on the plateform after 2015. The current usage metrics is available 48-96 hours after online publication and is updated daily on week days.
Initial download of the metrics may take a while.