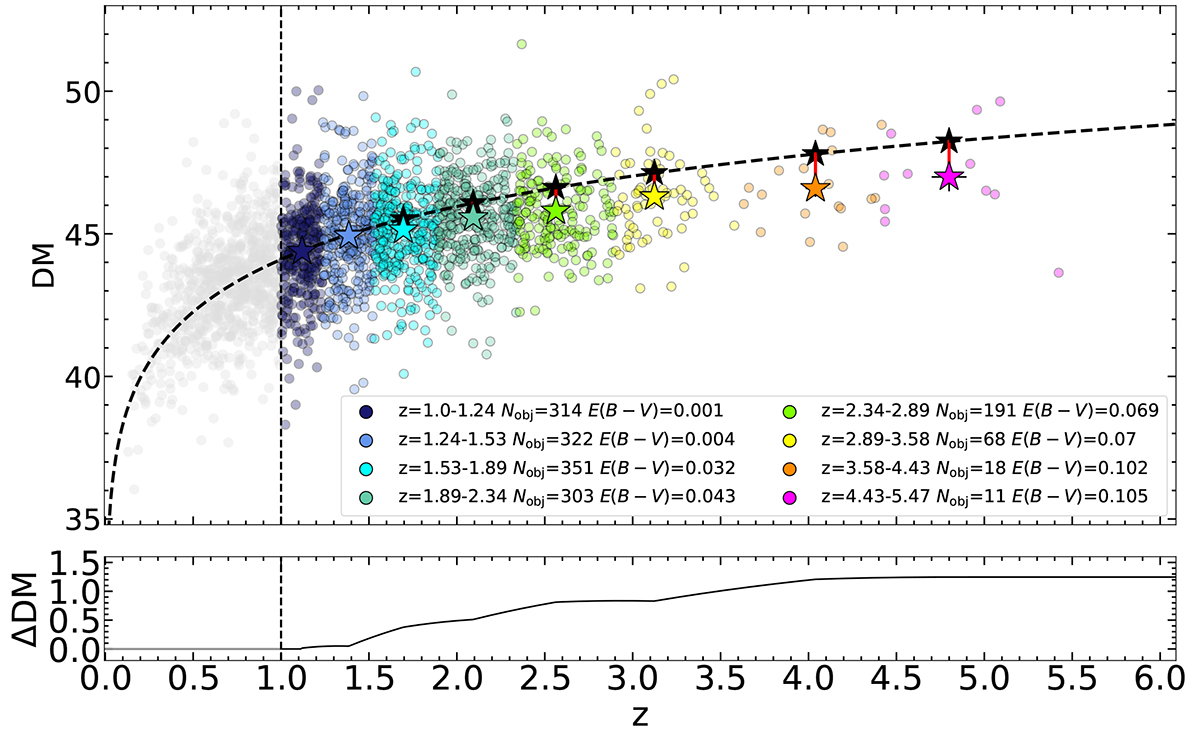
Fig. 13.
Download original image
Effect of the intrinsic extinction on the Hubble–Lemaître diagram. Top panel: Hubble–Lemaître diagram of the the sources used to investigate the possible effects of local reddening. The redshift bins used for this purpose are colour-coded in the legend together with the number of objects per bin and the corresponding E(B − V). Coloured stars represent the average values in each redshift bin, while black stars mark the ΛCDM model expectations, with red segments joining these two values. Increasingly high values of E(B − V) are needed in order to produce the observed tension with the concordance cosmological model. Bottom panel: difference between the predicted and observed distance modulus (ΔDM). Values are not extrapolated below z = 1.0 and above z = 4.8.
Current usage metrics show cumulative count of Article Views (full-text article views including HTML views, PDF and ePub downloads, according to the available data) and Abstracts Views on Vision4Press platform.
Data correspond to usage on the plateform after 2015. The current usage metrics is available 48-96 hours after online publication and is updated daily on week days.
Initial download of the metrics may take a while.