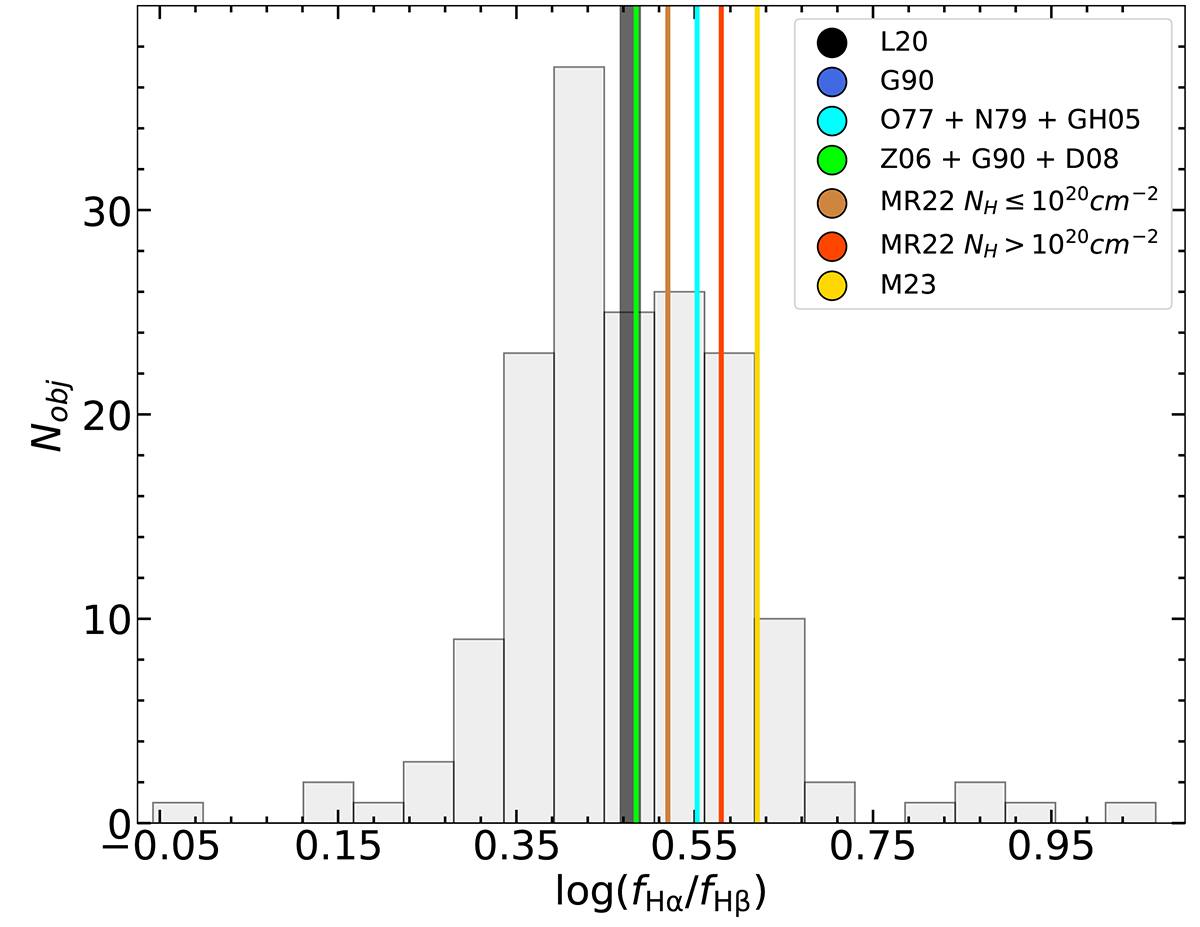
Fig. 12.
Download original image
Distribution of log(Hαbr/Hβbr) for our sources with available data. The mean values from other literature samples (Osterbrock 1977, O77, Neugebauer et al. 1979, N79, Goodrich 1990, G90, Greene & Ho 2005, GH05, Zhou et al. 2006, Z06, Dong et al. 2007, D07, Mejía-Restrepo et al. 2022, MR22, Ma et al. 2023, M23) are also shown for reference according to the colour code. The mean of our values is shown in black. The BASS sample described in Mejía-Restrepo et al. (2022) has been split according to the column density NH inferred from the X-ray analysis.
Current usage metrics show cumulative count of Article Views (full-text article views including HTML views, PDF and ePub downloads, according to the available data) and Abstracts Views on Vision4Press platform.
Data correspond to usage on the plateform after 2015. The current usage metrics is available 48-96 hours after online publication and is updated daily on week days.
Initial download of the metrics may take a while.