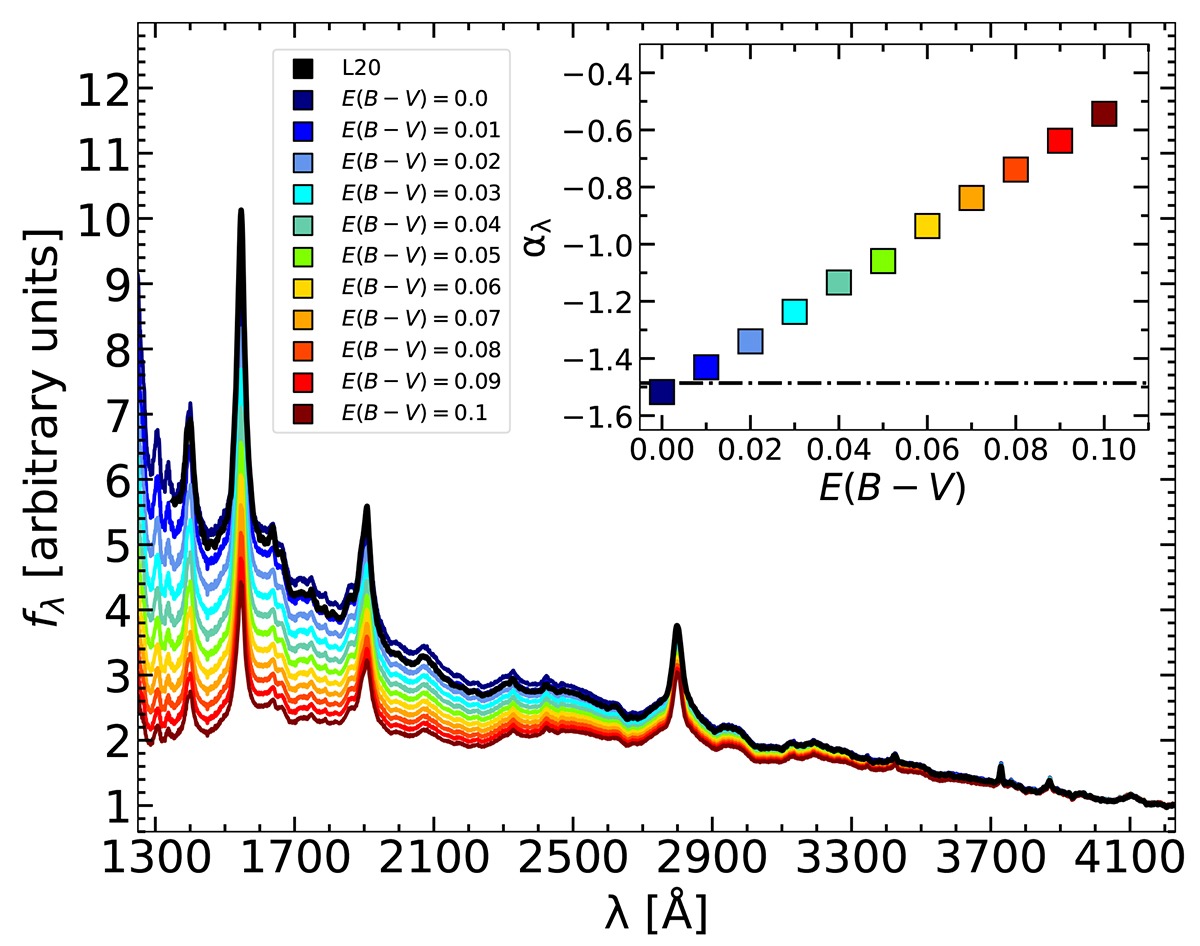
Fig. 11.
Download original image
Extinction of the VB01 template according to the colour-coded values. All the spectra are scaled by their 4200-Å flux, where extinction becomes less relevant. The black spectrum is our full sample stack and is in very good agreement with a low degree of extinction. The inset shows the best-fit slope in the range 1300–4100 Å of the VB01 template reddened as a function of the E(B − V) value. The black dot-dashed line represents the slope of the continuum fitted to our stack. Minimal levels of extinction are allowed to match the reddened template with our composite. We note that the visual match between the L20 and the VB01 reddened template depends slightly on the scaling wavelength. The slope derived from the fits, however, does not depend on such a wavelength.
Current usage metrics show cumulative count of Article Views (full-text article views including HTML views, PDF and ePub downloads, according to the available data) and Abstracts Views on Vision4Press platform.
Data correspond to usage on the plateform after 2015. The current usage metrics is available 48-96 hours after online publication and is updated daily on week days.
Initial download of the metrics may take a while.