Open Access
Fig. 10.
Download original image
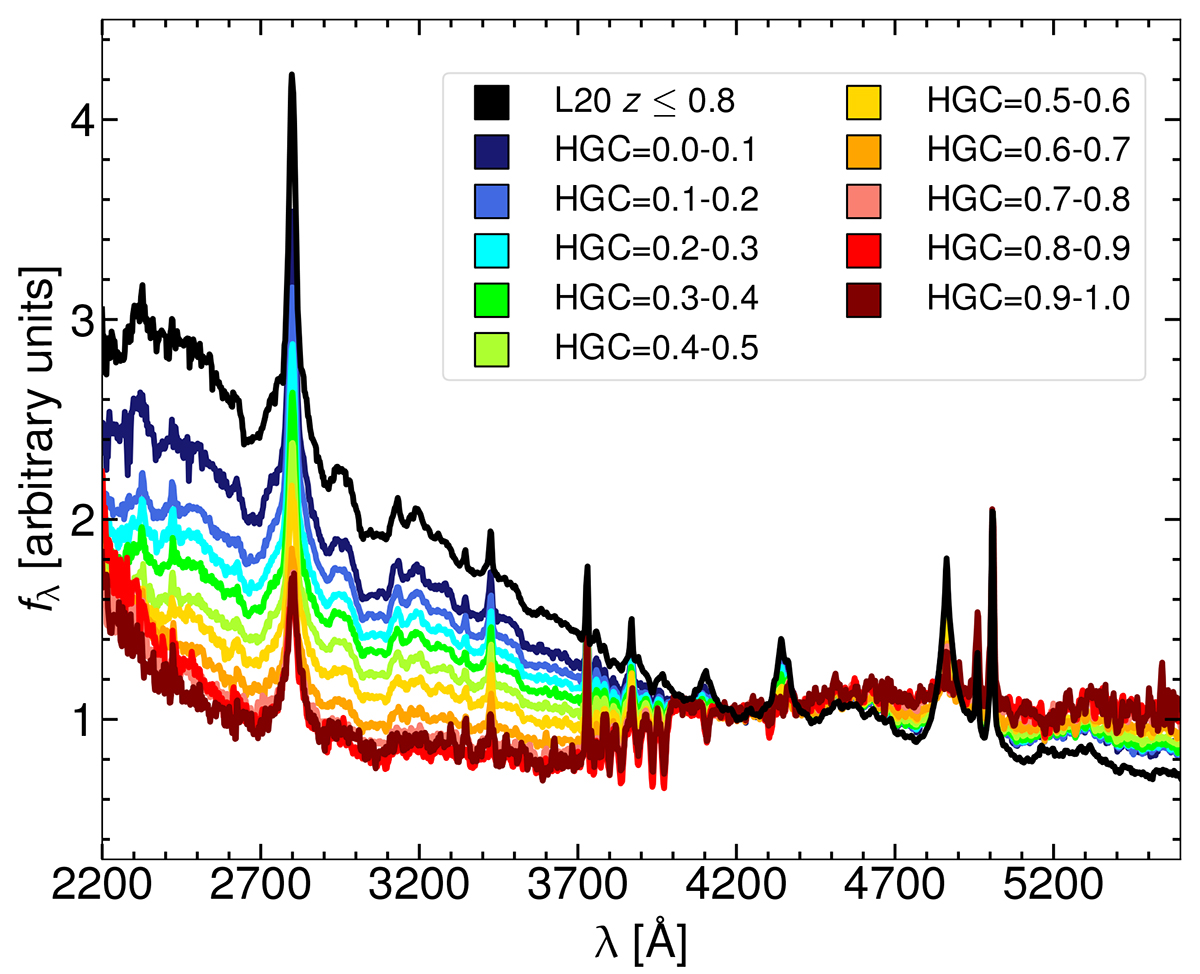
Comparison between the stacks in bins of HGF and our reference spectrum (black) for the z ≤ 0.8 interval, as colour-coded in the legend. All the spectra are scaled to their 4200 Å flux. Increasingly host-dominated composites exhibit flatter UV continua.
Current usage metrics show cumulative count of Article Views (full-text article views including HTML views, PDF and ePub downloads, according to the available data) and Abstracts Views on Vision4Press platform.
Data correspond to usage on the plateform after 2015. The current usage metrics is available 48-96 hours after online publication and is updated daily on week days.
Initial download of the metrics may take a while.