Fig. 6
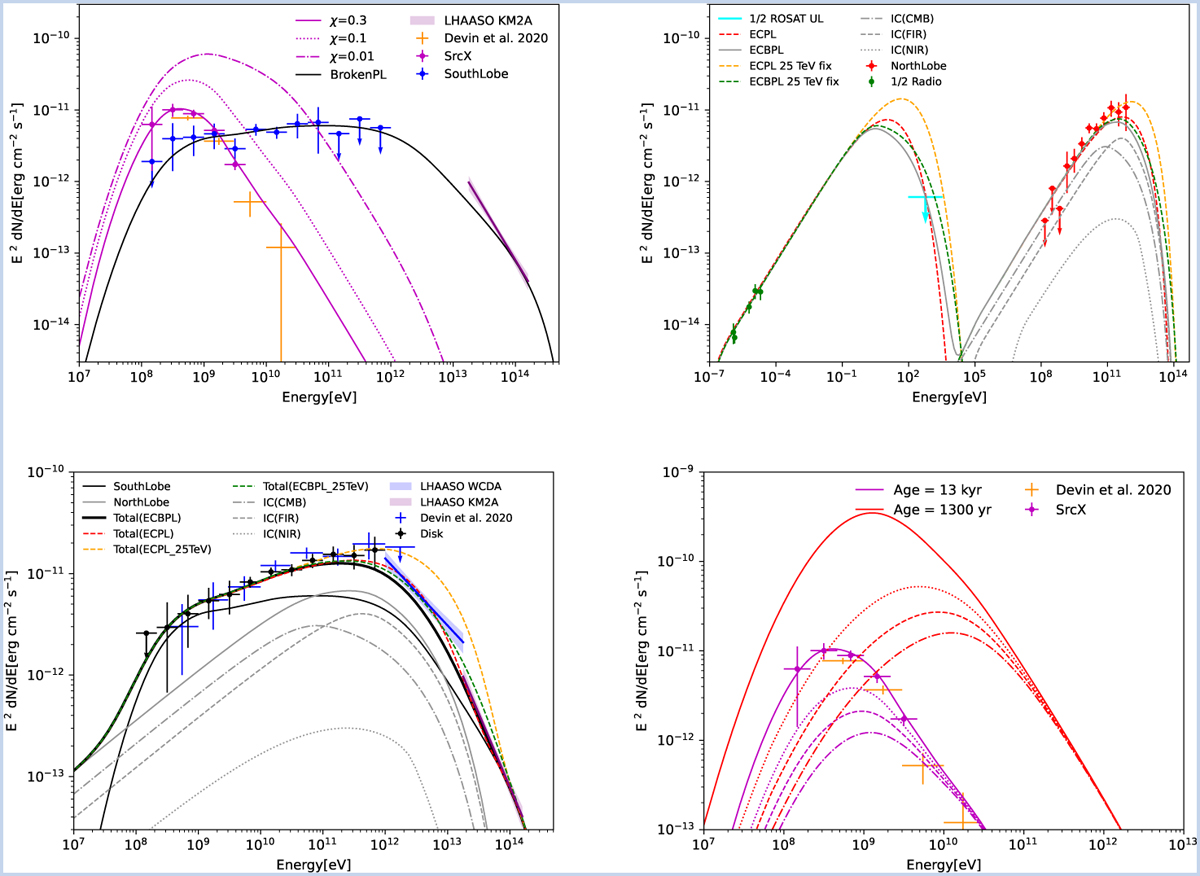
Download original image
Modelling of the multi-wavelength spectra of the SrcX southlobe (top-left), northlobe (top-right), and disk (bottom-left). The blue and purple butterfly shadow regions come from recent LHAASO results (Cao et al. 2024). The orange data points come from 4FGL J0426.5+5434 as measured by Devin et al. (2020). Top left: Solid, dashed, and dash-dotted magenta lines show the spectra produced by escaping ions with different values of χ indicated, and the black solid line shows the hadronic model for trapped protons with a broken power-law distribution. Top right: Leptonic models, where the power law (ECPL) and broken power law (ECBPL) are presented by red dashed and grey solid lines, while the orange and green dashed lines show a special ECPL and ECBPL case where the cut-off energy is fixed to 25 TeV. The radio fluxes and the X-ray upper-limit come from Zeng et al. (2021) and Devin et al. (2020), respectively. Bottom left: Hybrid model for the total γ-ray flux shown as black solid, red dashed, orange dashed lines added by different leptonic spectral types. Blue data points are derived from the best-fit results measured by Devin et al. (2020) for comparison. Bottom right: Dependence of the SED on the SNR age and rs. The solid, dotted, dashed, dash-dotted lines correspond to rs = 21.4/35/45/55 pc, respectively.
Current usage metrics show cumulative count of Article Views (full-text article views including HTML views, PDF and ePub downloads, according to the available data) and Abstracts Views on Vision4Press platform.
Data correspond to usage on the plateform after 2015. The current usage metrics is available 48-96 hours after online publication and is updated daily on week days.
Initial download of the metrics may take a while.