Fig. 5
Download original image
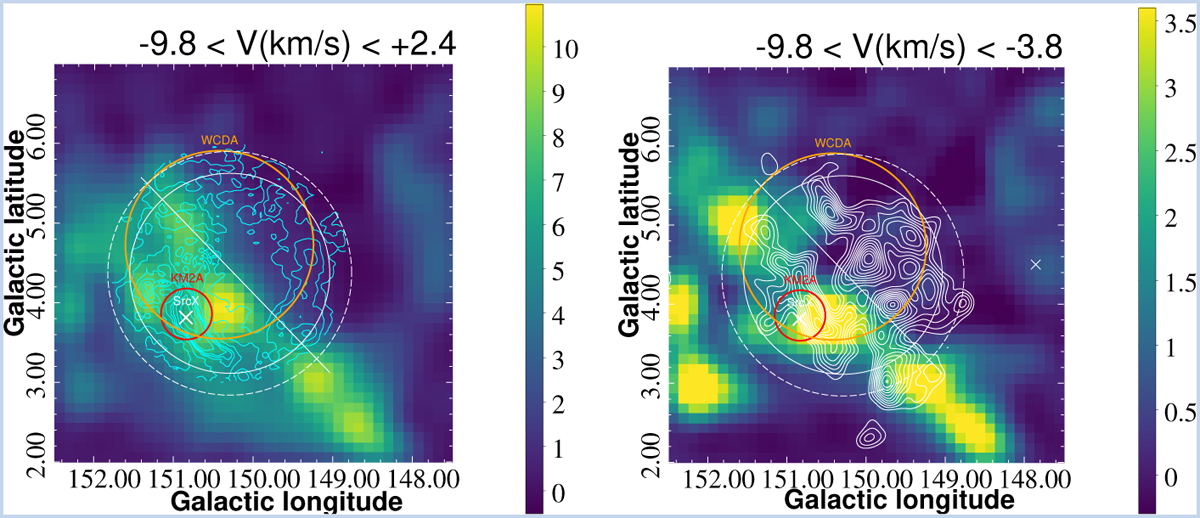
Integrated CO (J = 1–0) emission intensity (Kkm s−1) toward SNR G150.3+4.5 at 115 GHz using CO composite survey (Dame et al. 2001). Panel left: integrated on the whole velocity range [−9.8, +2.4] km s−1, and overlaid with the radio shell structure extracted from Urumqi λ6cm results (Gao & Han 2014). Panel right: integrated on [−9.8, −3.8] km s−1 while overlaid with the GeV emission contour line generated from the top right panel in Fig. 1. Other labels are same as above.
Current usage metrics show cumulative count of Article Views (full-text article views including HTML views, PDF and ePub downloads, according to the available data) and Abstracts Views on Vision4Press platform.
Data correspond to usage on the plateform after 2015. The current usage metrics is available 48-96 hours after online publication and is updated daily on week days.
Initial download of the metrics may take a while.