Fig. 5.
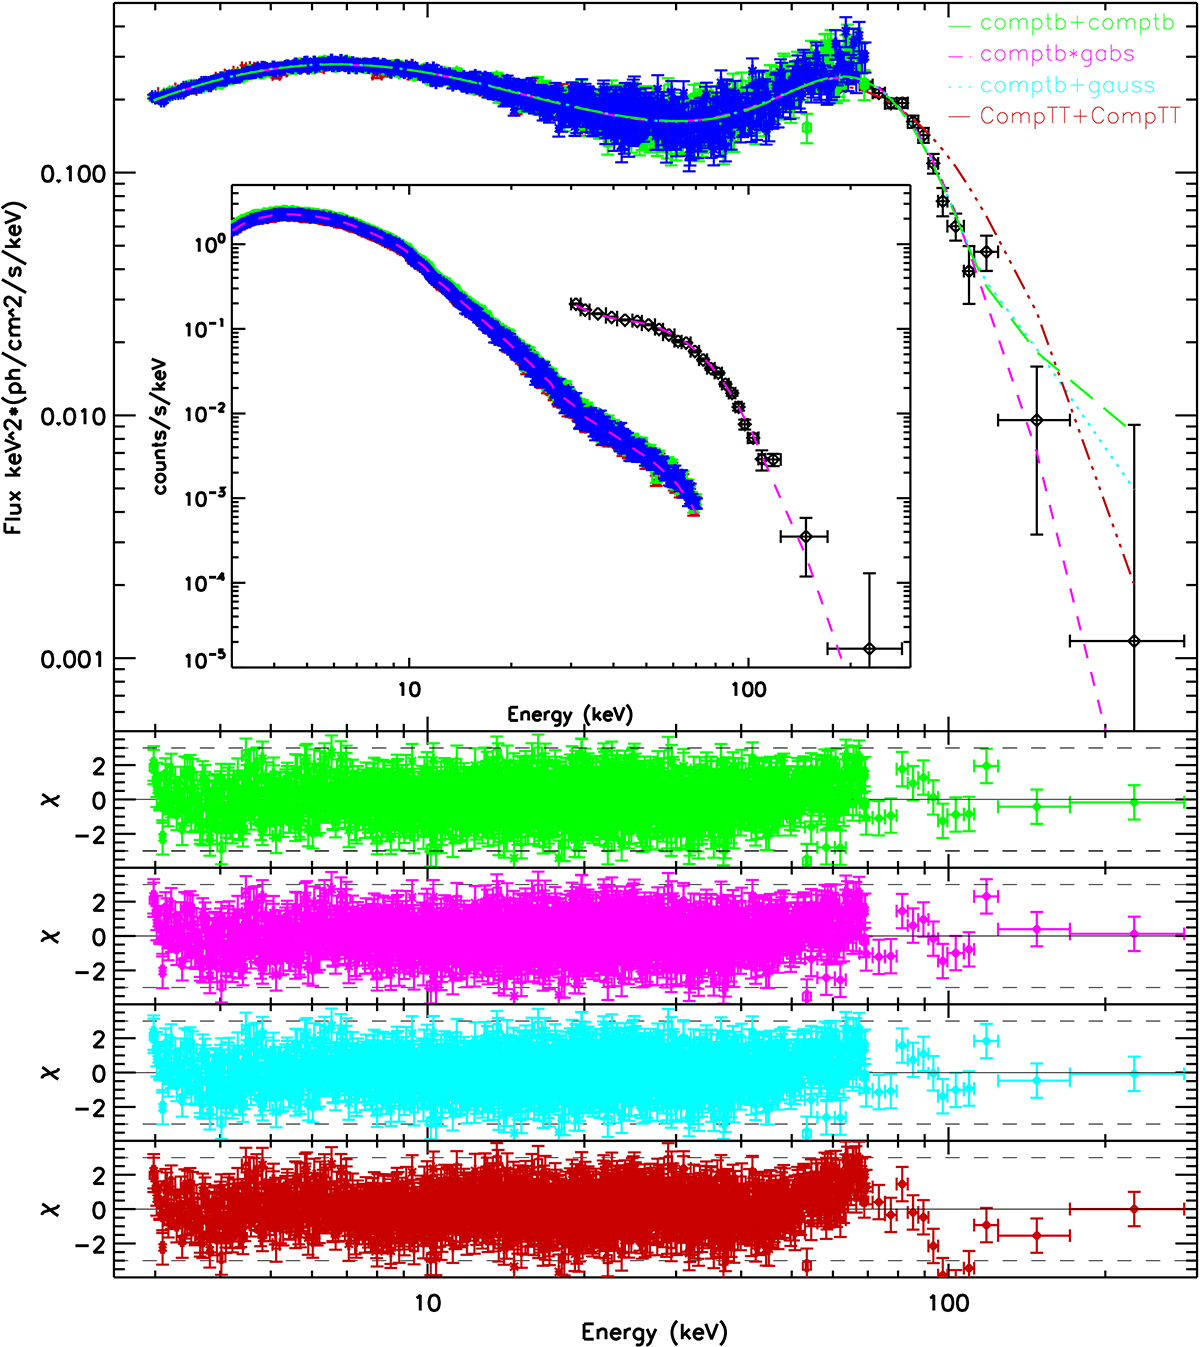
Download original image
X Per average spectrum with ISGRI (black diamonds), JEM-X (red triangles), NuSTAR/FPMA (blue stars), and FMPB (green squares). The best-fit models are overplotted with comptb+comptb (long green dashes), comptb*gabs (short magenta dashes), comptb+gauss (cyan dots), and CompTT+CompTT (red dots and dashes). The folded spectrum with the comptb*gabs model is shown as an inset. Plots of the residuals for the comptb+comptb, comptb*gabs, comptb+gauss, and CompTT+CompTT fits, respectively, are plotted in panels below the spectrum. Dashed lines are plotted at ±3σ.
Current usage metrics show cumulative count of Article Views (full-text article views including HTML views, PDF and ePub downloads, according to the available data) and Abstracts Views on Vision4Press platform.
Data correspond to usage on the plateform after 2015. The current usage metrics is available 48-96 hours after online publication and is updated daily on week days.
Initial download of the metrics may take a while.