Open Access
Fig. 4.
Download original image
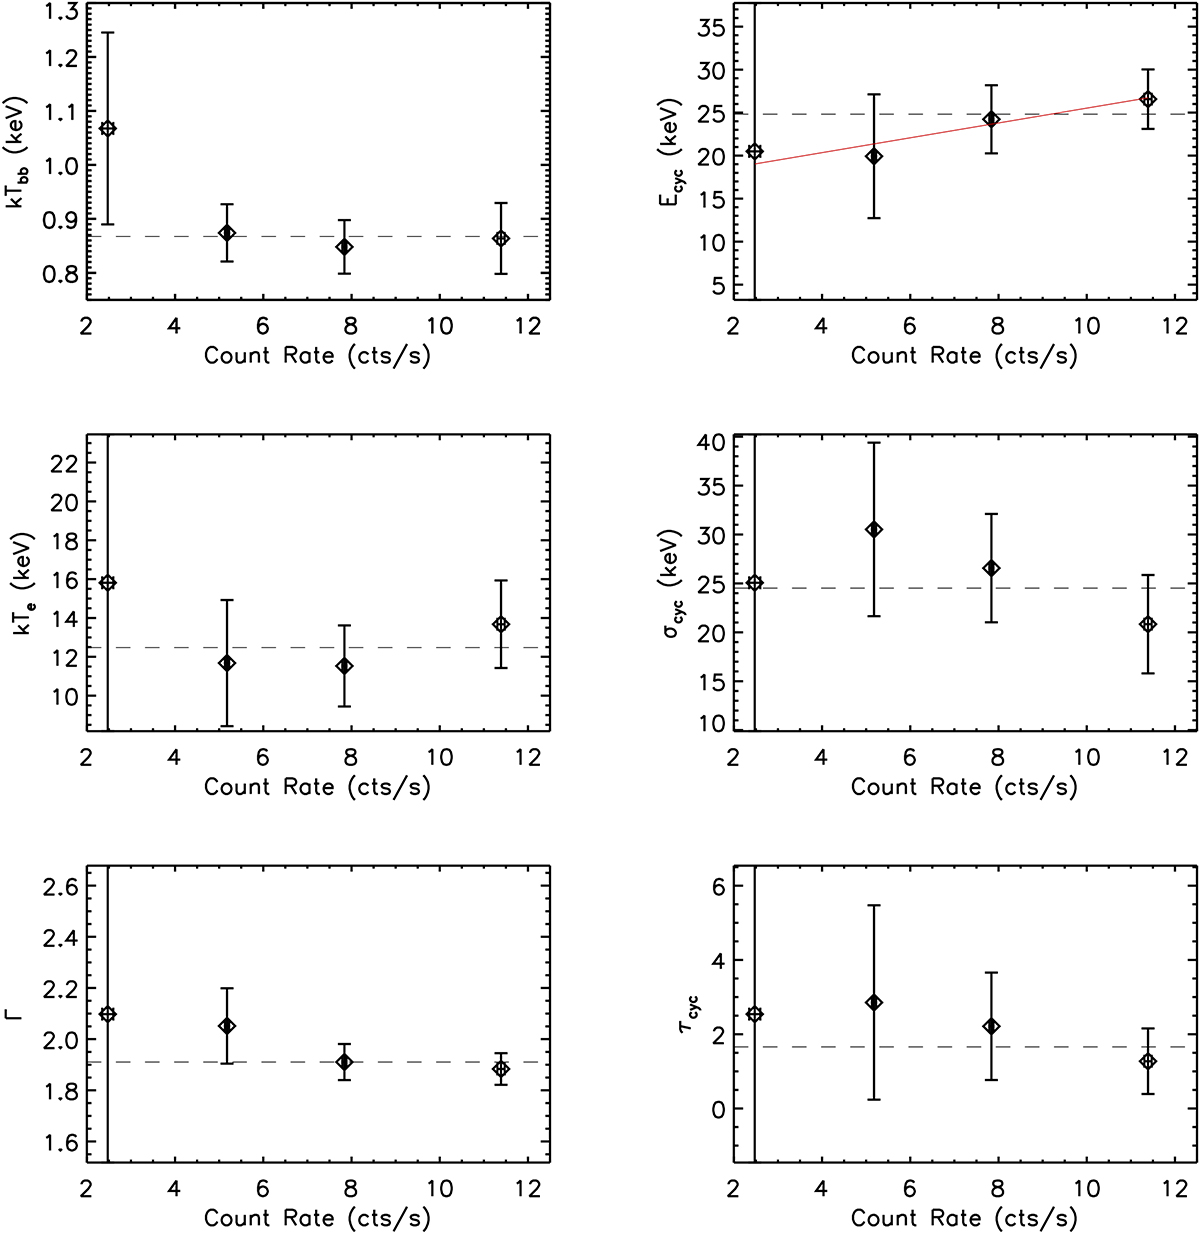
Evolution of X Per best-fit parameters to a nthcomp*gabs model for different flux levels. The average values are overplotted as a dashed line in each panel. The red line in the Ecyc panel is a fit to the cyclotron energy vs. count rate.
Current usage metrics show cumulative count of Article Views (full-text article views including HTML views, PDF and ePub downloads, according to the available data) and Abstracts Views on Vision4Press platform.
Data correspond to usage on the plateform after 2015. The current usage metrics is available 48-96 hours after online publication and is updated daily on week days.
Initial download of the metrics may take a while.