Open Access
Fig. 7
Download original image
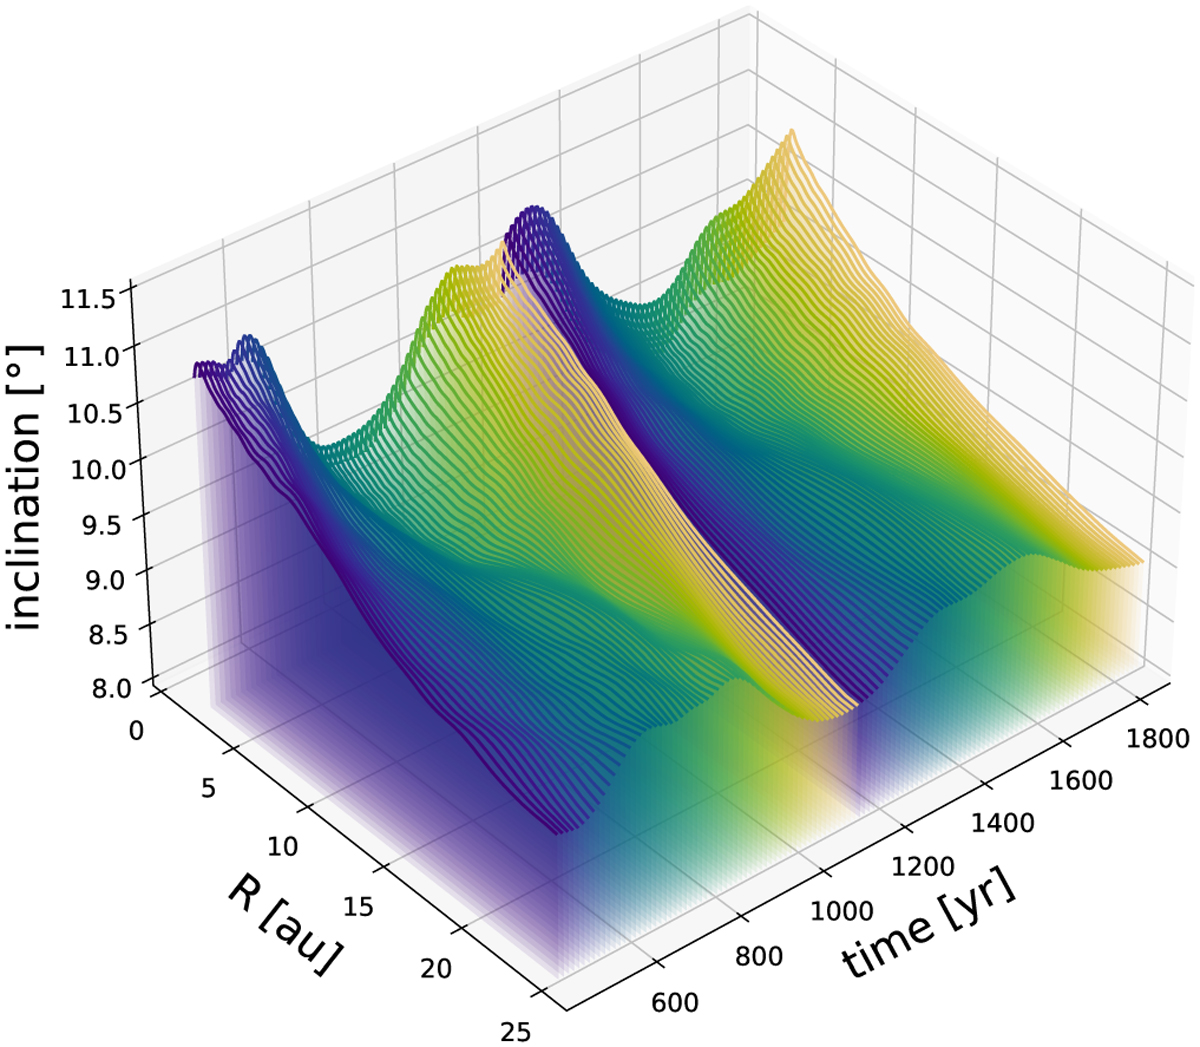
Inclination profile evolution during the first and second periods of the inclination oscillation. Each period is indicated by the color scale from blue to yellow. The first period extends from 420 to 1140 yr, the second from 1140 to 1860 yr.
Current usage metrics show cumulative count of Article Views (full-text article views including HTML views, PDF and ePub downloads, according to the available data) and Abstracts Views on Vision4Press platform.
Data correspond to usage on the plateform after 2015. The current usage metrics is available 48-96 hours after online publication and is updated daily on week days.
Initial download of the metrics may take a while.