Open Access
Fig. A.4
Download original image
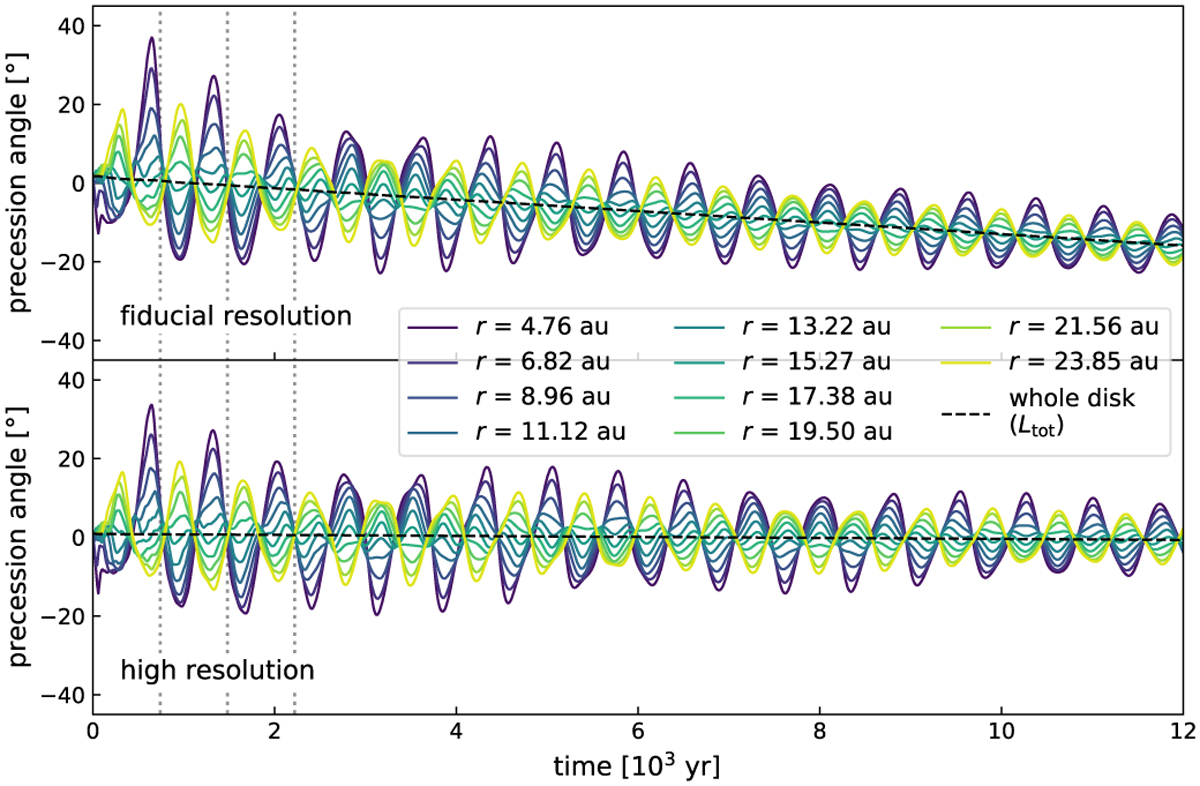
Precession angles for different radii (colored lines) in simulations with different resolutions. The black dashed line in each panel shows the precession angle of the angular momentum vector Ltot of the whole disk. The grey dotted lines indicate precession periods of roughly 740 yr. Similar to Figure 23.
Current usage metrics show cumulative count of Article Views (full-text article views including HTML views, PDF and ePub downloads, according to the available data) and Abstracts Views on Vision4Press platform.
Data correspond to usage on the plateform after 2015. The current usage metrics is available 48-96 hours after online publication and is updated daily on week days.
Initial download of the metrics may take a while.