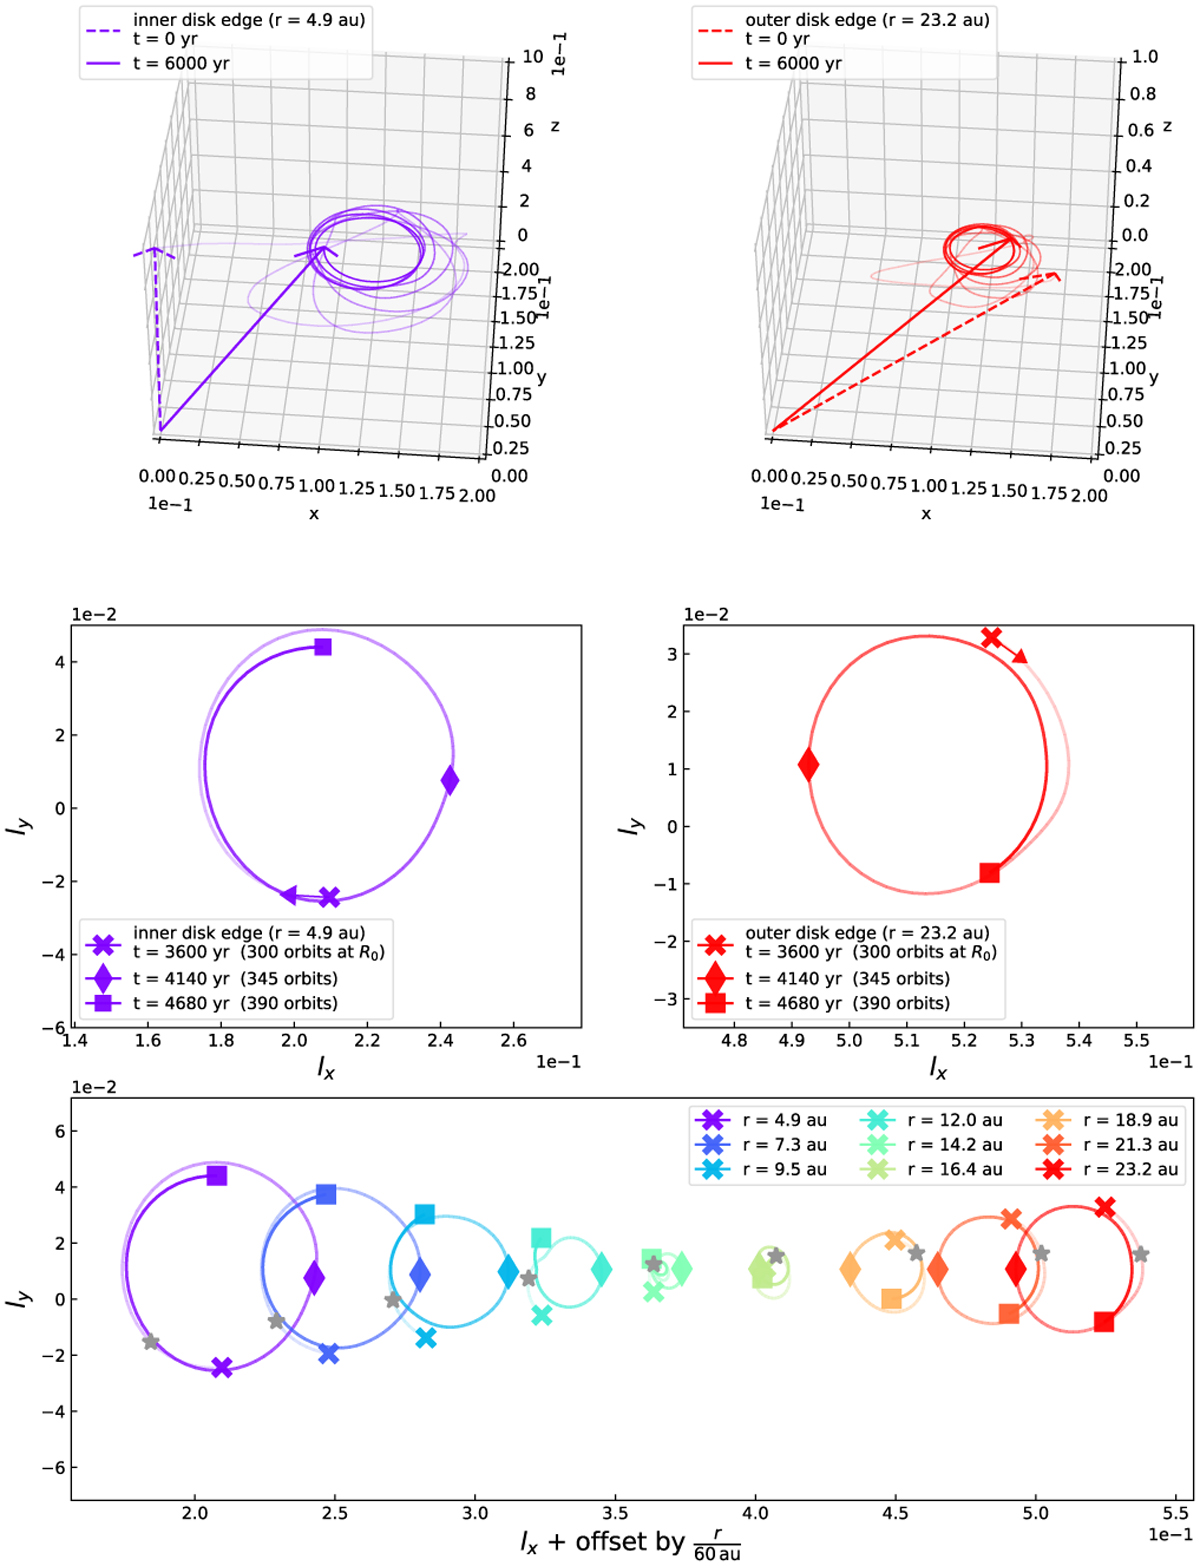
Fig. 18
Download original image
Twist motion in the warped disk simulation. Top row: unit angular momentum vectors close to the inner (left panel) and outer (right panel) edge of the disk for the first t = 6000 yr. Similar to Fig. 17. Middle row: x-y components of the unit angular momentum vector at the same radii as in the top row, but only for the time period between 300 and 390 orbits at R0, chosen to roughly show 1.5 precession periods. The direction of the precession is indicated by the arrows. x-markers show the beginning of the plotted time, squares the end. Diamonds indicate the middle of this time period (45 orbits after the x-markers). Bottom row: same as middle row, but for various radii, plotted with an offset of r/(60 au) in y-direction to disentangle the twist at different radii. The stars show the lx−ly components at a snapshot at t = 3696 yr (308 orbits at R0), which shows a twisted state in the time evolution.
Current usage metrics show cumulative count of Article Views (full-text article views including HTML views, PDF and ePub downloads, according to the available data) and Abstracts Views on Vision4Press platform.
Data correspond to usage on the plateform after 2015. The current usage metrics is available 48-96 hours after online publication and is updated daily on week days.
Initial download of the metrics may take a while.