Open Access
Fig. 17
Download original image
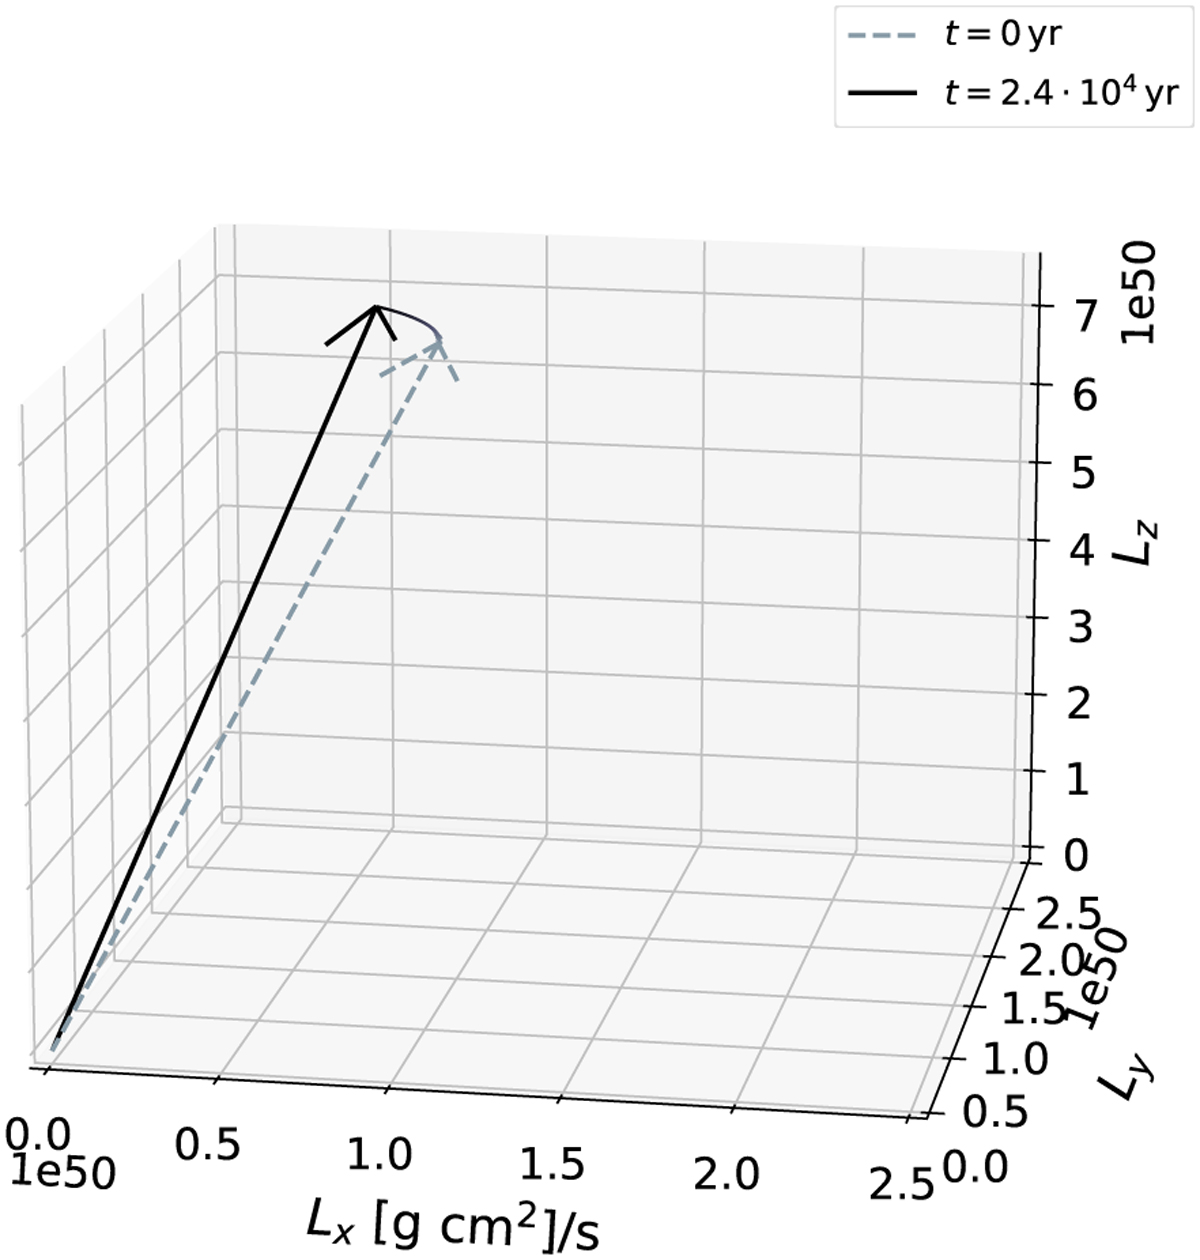
Direction of the total angular momentum vector in the beginning of the simulation t = 0 yr (grey dashed line) and in the end t = 2.4 × 10⁴ yr (solid black line). The line connecting the two arrows indicates the time evolution with darker color the later the time.
Current usage metrics show cumulative count of Article Views (full-text article views including HTML views, PDF and ePub downloads, according to the available data) and Abstracts Views on Vision4Press platform.
Data correspond to usage on the plateform after 2015. The current usage metrics is available 48-96 hours after online publication and is updated daily on week days.
Initial download of the metrics may take a while.