Open Access
Fig. 14
Download original image
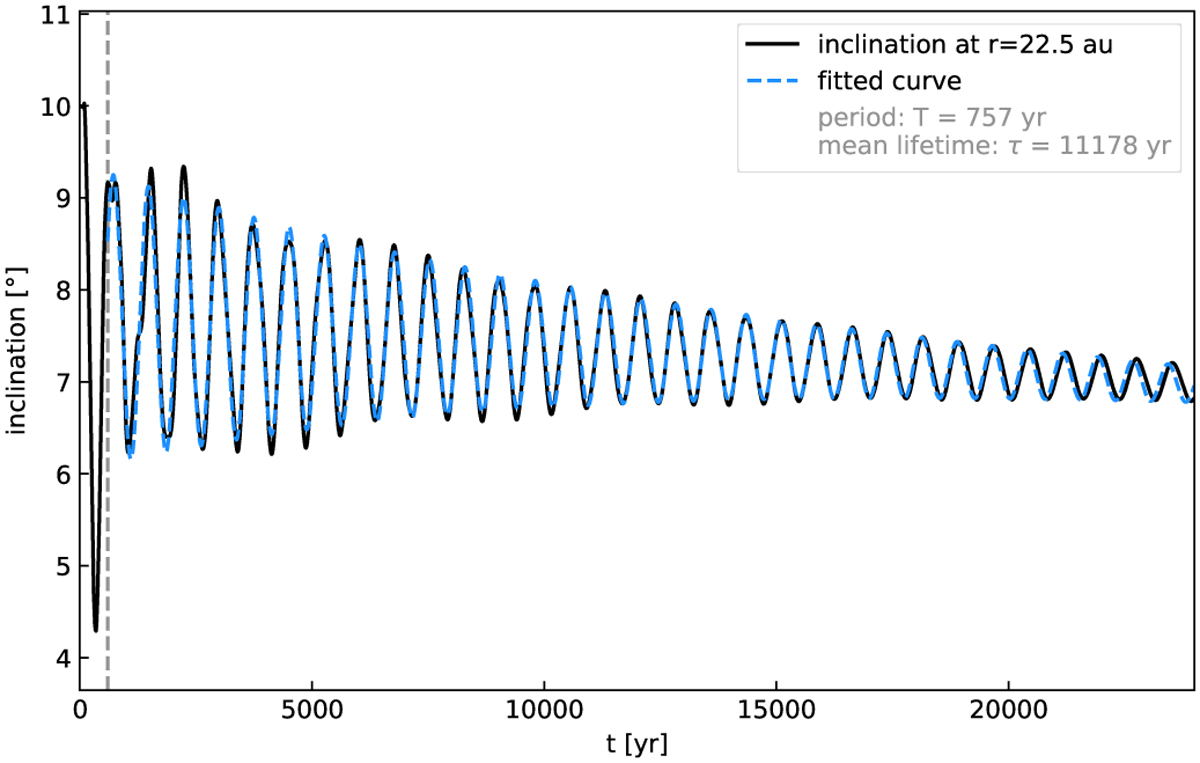
Decay of inclination in the warped disk simulation. We chose to evaluate the inclination close to the outer edge at a radius of 22.5 au. The black line shows the simulation data, the blue dashed line the fit. The grey dashed line indicates the starting point of the fit.
Current usage metrics show cumulative count of Article Views (full-text article views including HTML views, PDF and ePub downloads, according to the available data) and Abstracts Views on Vision4Press platform.
Data correspond to usage on the plateform after 2015. The current usage metrics is available 48-96 hours after online publication and is updated daily on week days.
Initial download of the metrics may take a while.