Fig. 9
Download original image
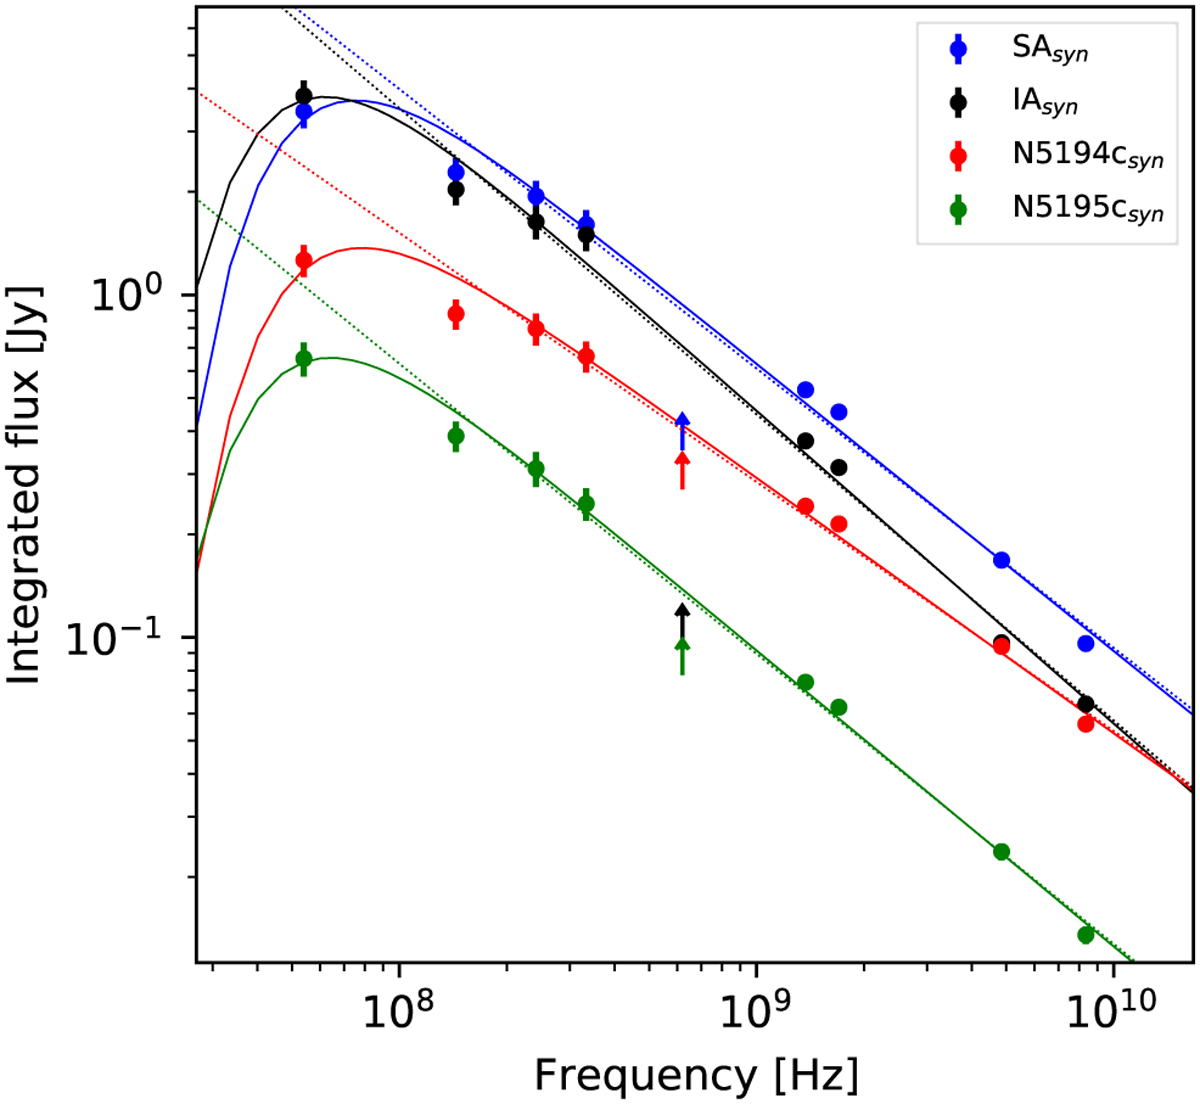
Non-thermal radio continuum spectra for the spiral arm (SA), inter-arm (IA), and core regions (N5194c and N5195c). The flux densities at 619 MHz are only given as lower limits and are not included in the analysis. The solid lines are the best-fitting free–free absorption models (Eq. (10)). The dotted lines show the power-law fits for frequencies ≥ 144 MHz.
Current usage metrics show cumulative count of Article Views (full-text article views including HTML views, PDF and ePub downloads, according to the available data) and Abstracts Views on Vision4Press platform.
Data correspond to usage on the plateform after 2015. The current usage metrics is available 48-96 hours after online publication and is updated daily on week days.
Initial download of the metrics may take a while.